
Image
|
Figure Caption
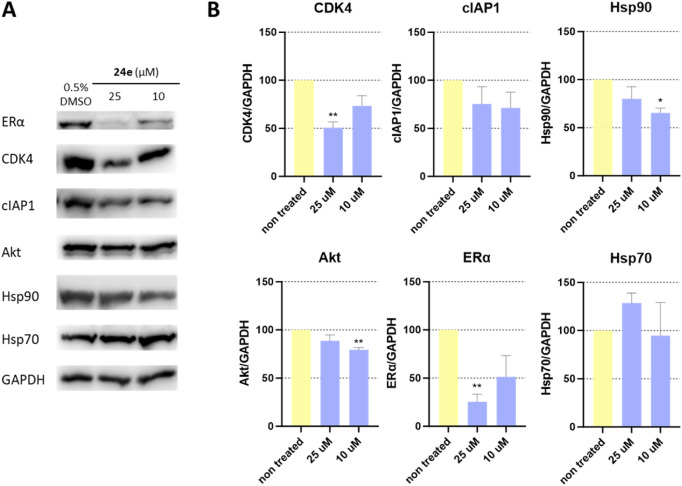
Fig. 7 A) Representation of western blots of 24e in MCF-7 breast cancer cell line where levels of ERα, CDK4, cIAP1, IGF1R, Akt (Hsp90 clients) and Hsp90, Hsp70 (HSR) were monitored. B) The protein levels were normalized and quantified in relation to GAPDH levels and the results are presented as bar graphs for each of the evaluated proteins. The bars represent mean values with SD. Unpaired t-test was applied to determine statistical significance (∗p < 0.05, ∗∗p < 0.01). The images used for quantification are presented in Supplementary information in Figs. S29 and S30.
Acknowledgments
This image is the copyrighted work of the attributed author or publisher, and
ZFIN has permission only to display this image to its users.
Additional permissions should be obtained from the applicable author or publisher of the image.
Full text @ Eur. J. Med. Chem.