
|
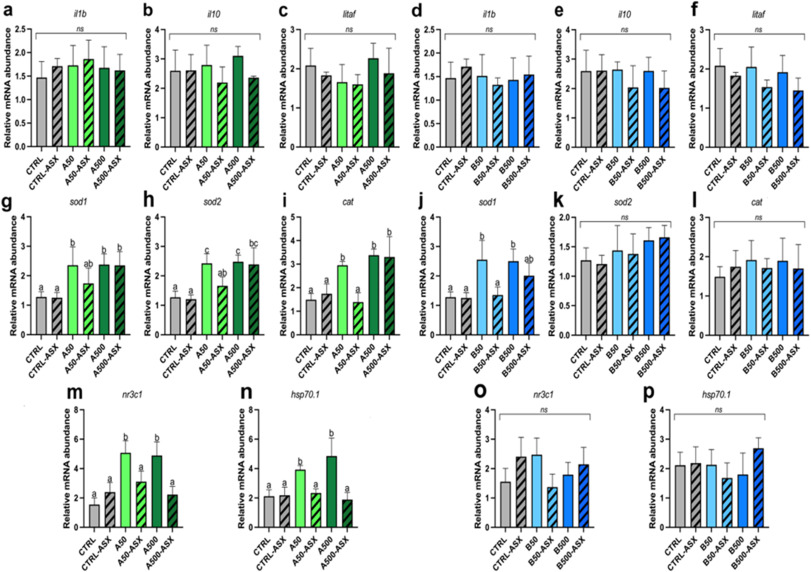
Fig. 5 Real-time qPCR results. Relative mRNA abundance of genes involved in immune response (il1b, il10, litaf) analysed in the intestine and involved oxidative stress response (sod1, sod2, cat) and stress response (nr3c1 and hsp70.1) analysed in the liver of adult zebrafish fed the experimental diets. (a-c; g-i; m,n) groups fed A-diets (A50, A50-ASX, A500, A500-ASX) compared to those fed the CTRL ones (CTRL and CTRL-ASX); (d-f; j-l; o,p) groups fed B-diets (B50, B50-ASX, B500, B500-ASX) compared to those fed the CTRL ones (CTRL and CTRL-ASX). Data are reported as mean ± SD (n = 5). a-c Different letters denote statistically significant differences among the experimental group. ns, no significant differences among the experimental groups (p > 0.05).