
Image
|
Figure Caption
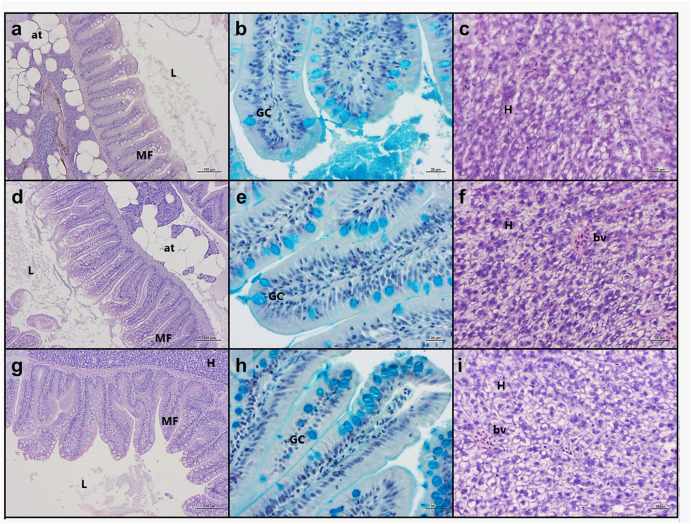
Fig. 4 Histological evaluation of intestine and liver. Example of histomorphology of zebrafish fed (a-c) CTRL-diets, (d-f) A-diets, (g-h) B-diets. (a,d,g) intestine, scale bars = 100 μm; (b,e,h) details of Ab + goblet cells, scale bars = 20 μm; (c,f,i) hepatic parenchyma, scale bars = 20 μm. Abbreviations: at, perivisceral adipose tissue; L, gut lumen; MF, intestinal mucosal folds; H, hepatocytes; GC, goblet cells; bv, blood vessels.
Acknowledgments
This image is the copyrighted work of the attributed author or publisher, and
ZFIN has permission only to display this image to its users.
Additional permissions should be obtained from the applicable author or publisher of the image.
Full text @ Chemosphere