
|
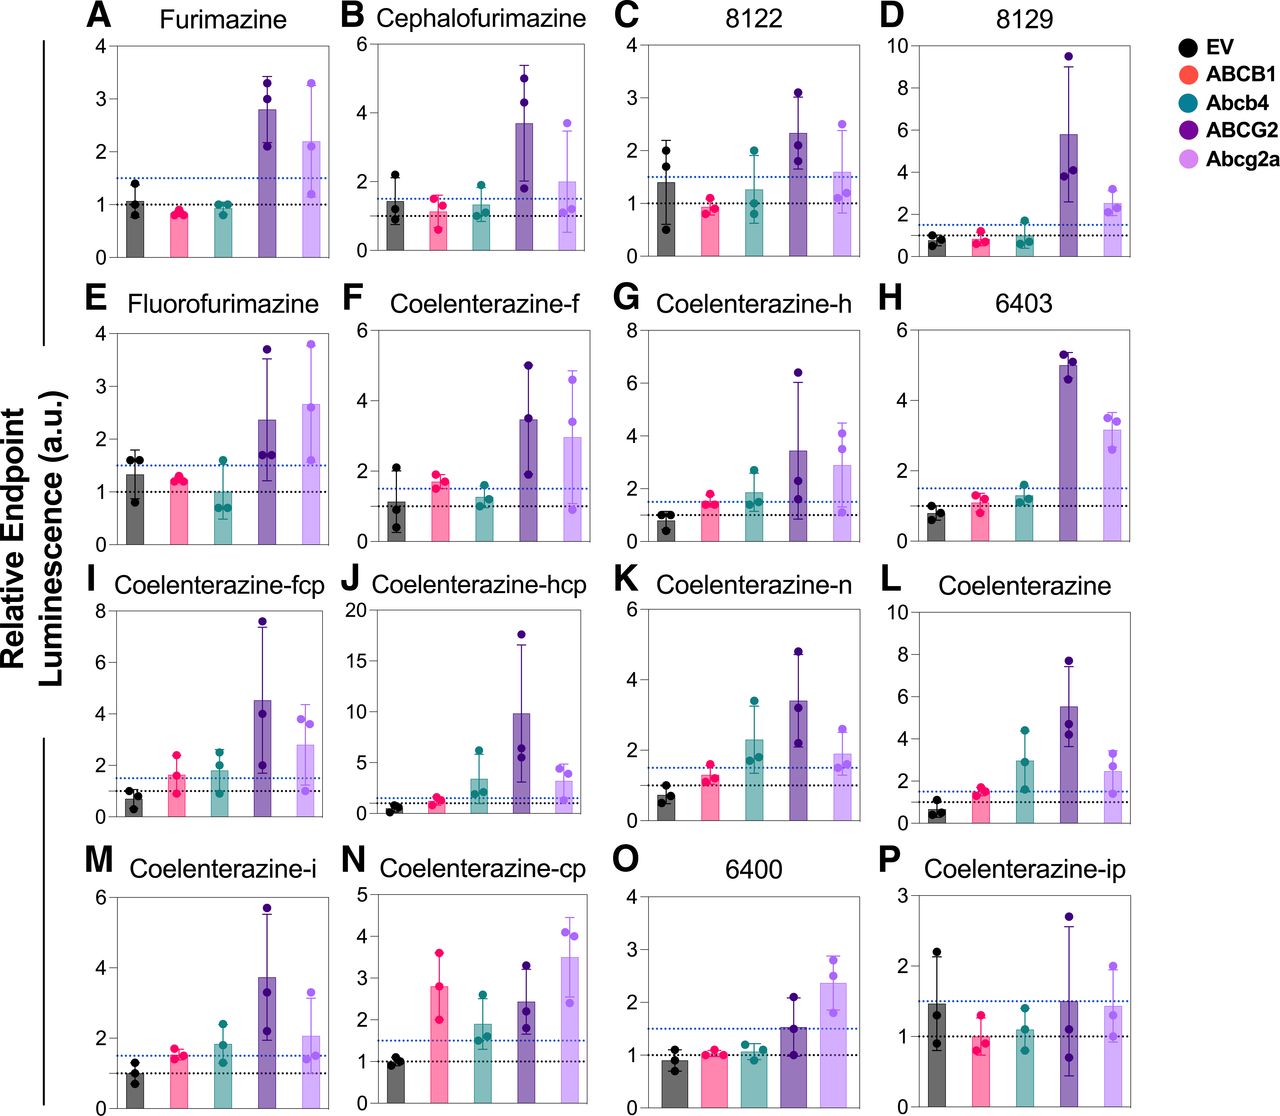
Fig. 5 Percent increase in residual luminescence. Measurements taken after 5 minutes of efflux for cells treated or not treated with ABC transporter inhibitors (for ABCG2 and Abcg2a, Ko143, 5 μM; for ABCB1 and Abcb4, elacridar, 3 μM; 470 nM NanoLuc substrate of interest) for (A) furimazine, (B) cephalofurimazine, (C) 8122, (D) 8129, (E) fluorofurimazine, (F) coelenterazine-f, (G) coelenterazine-h, (H) 6403, (I) coelenterazine-fcp, (J) coelenterazine-hcp, (K) coelenterazine-n, (L) coelenterazine, (M) coelenterazine-i, (N) coelenterazine-cp, (O) 6400, and (P) coelenterazine-ip. Larger values indicate a more strongly effluxed substrate. Data presented as mean ± S.D. of luminescence at 5 minutes in the inhibited condition divided by luminescence at 5 minutes in the uninhibited condition. Data three biological replicates of all substrates. The black dashed line at 1 indicates the level at which luminescence from inhibited and uninhibited samples were equal. The line at 1.5 indicates the threshold set to indicate a detectable difference in future experiments.