
|
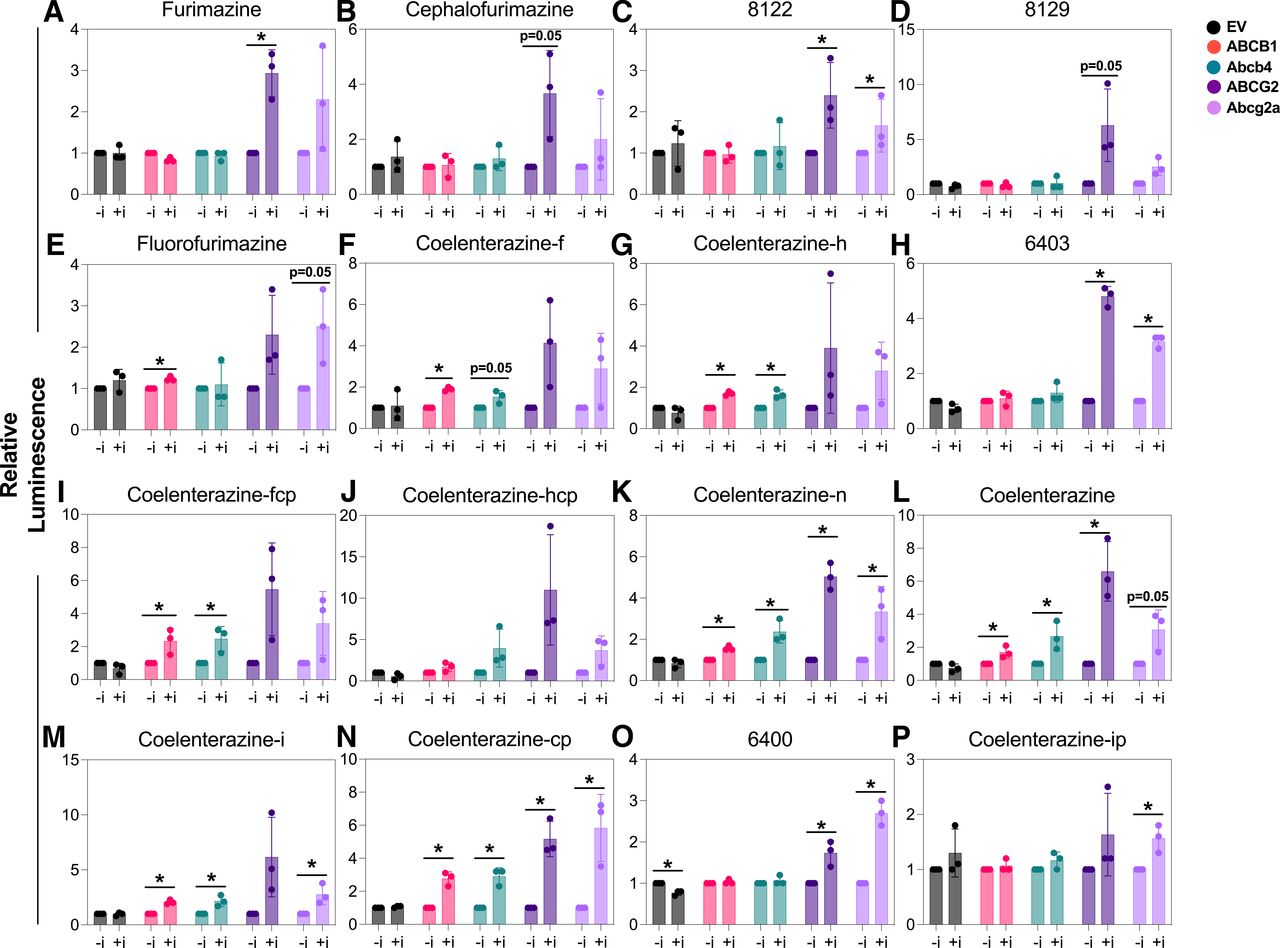
Fig. 4 Area under the curve values from bioluminescence-versus-time with [+ inhibitor (i)] and without (− i) ABC transporter inhibitors permit identification of ABC transporter substrates. HEK293 cells transfected with the transporter of interest and NanoLuciferase were incubated with inhibitor [elacridar (3 μM) for ABCB1 and Abcb4; Ko143 (5 μM) for ABCG2 and Abcg2a] for 30 minutes before introduction of the NanoLuc substrate (470 nM) for 1 minute. Bioluminescence was measured every minute for 5 minutes after the media were refreshed. AUCs of bioluminescence-versus-time graphs are shown for uninhibited (− i) and inhibited (+ i) (A) furimazine, (B) cephalofurimazine, (C) 8122, (D) 8129, (E) fluorofurimazine, (F) coelenterazine-f, (G) coelenterazine-h, (H) 6403, (I) coelenterazine-fcp, (J) coelenterazine-hcp, (K) coelenterazine-n, (L) coelenterazine, (M) coelenterazine-i, (N) coelenterazine-cp, (O) 6400, and (P) coelenterazine-ip in a panel of transfected HEK293 cells. Graphs show mean ± S.D. of bioluminescent area under the curve normalized to each replicate’s uninhibited condition. Inhibited values are normalized to each replicate’s uninhibited control. Data represent three biological replicates of all substrates. One-tailed Student’s t test; *P < 0.05.