
|
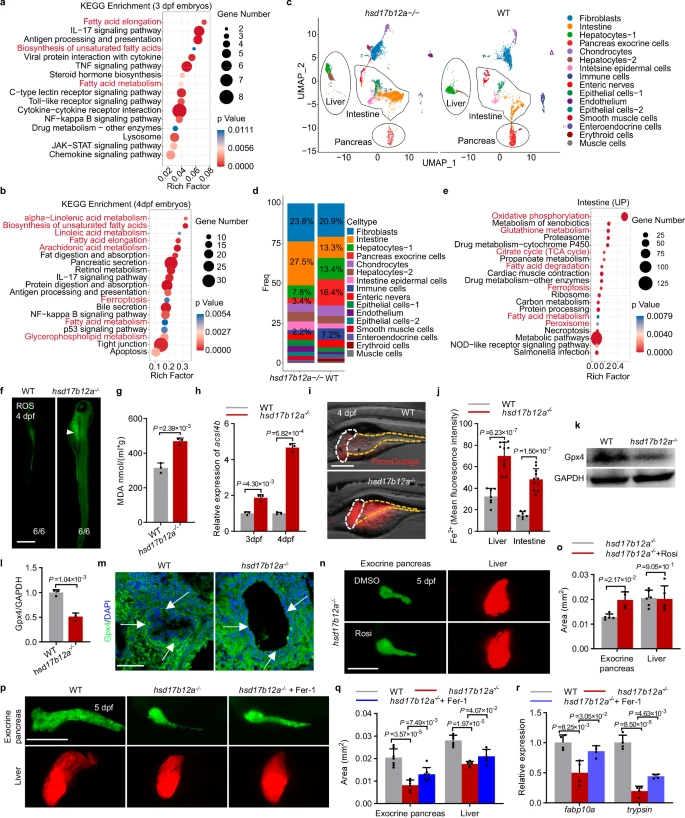
Fig. 5 Ferroptosis hinders the digestive organ expansion.a, b KEGG pathway analysis of differentially expressed genes in hsd17b12a−/− compared to WT at 3 dpf and 4 dpf (p-value < 0.05). c Single-cell sequencing analysis of the liver, intestine, and pancreas in hsd17b12a−/− and WT at 4 dpf. The “Liver” label indicates liver-origin cells, the “Pancreas” label indicates pancreas-origin cells, and the “Intestine” label indicates intestinal-origin cells. d The proportions of each cell type in hsd17b12a−/− and WT. e KEGG pathway analysis of differentially expressed genes in the intestine of hsd17b12a−/− compared to WT (p-value < 0.05). f Detection of ROS (reactive oxygen species) in WT and hsd17b12a−/− at 4 dpf (n = 6). The white arrowheads indicate the intestine. Scale bar, 0.5 mm. g MDA (malondialdehyde) levels were measured in WT and hsd17b12a−/− at 4 dpf. h RT-qPCR of acsl4a and acsl4b in WT and hsd17b12a−/− at 3 dpf and 4 dpf. i, j Assessment and quantification of intracellular Fe2+ levels in larvae using FerroOrange probe in WT and hsd17b12a−/− at 4 dpf (n > 3). k, l Evaluation of GPX4 protein levels in WT and hsd17b12a−/− by western blot and quantification of GPX4 relative to GAPDH (n = 3). m Immunofluorescence analysis of GPX4 protein in the primitive intestine of WT and hsd17b12a−/− at 4 dpf (n = 3). The white arrows indicate the intestinal epithelia. Scale bar: 25 μm. n Fluorescence imaging of the liver and exocrine pancreas in hsd17b12a−/− treated with the Acsl4 inhibitor Rosi (rosiglitazone) (n > 3). o Measurement of the exocrine pancreas and liver areas in both untreated and Rosi-treated hsd17b12a−/−. Scale bar: 250 μm. p, q Fluorescence imaging and quantification of the exocrine pancreas and liver areas in WT, hsd17b12a−/−, and Fer-1 (Ferrostatin-1)-treated hsd17b12a−/− at 5 dpf (n > 3). Scale bar: 200 μm. r RT-PCR of fabp10a and trypsin at 5 dpf after treatment with Fer-1. Data in g, h, j, l, o, q, r are represented as mean ± S.D., using a two-tailed Student’s t test; each point represents an independent biological sample (n ≥ 3). Source data are provided as a Source Data file.