IMAGE

Figure 3

ID
ZDB-IMAGE-241129-41
Source
Figures for Wu et al., 2024
Image
Figure Caption

Figure 3

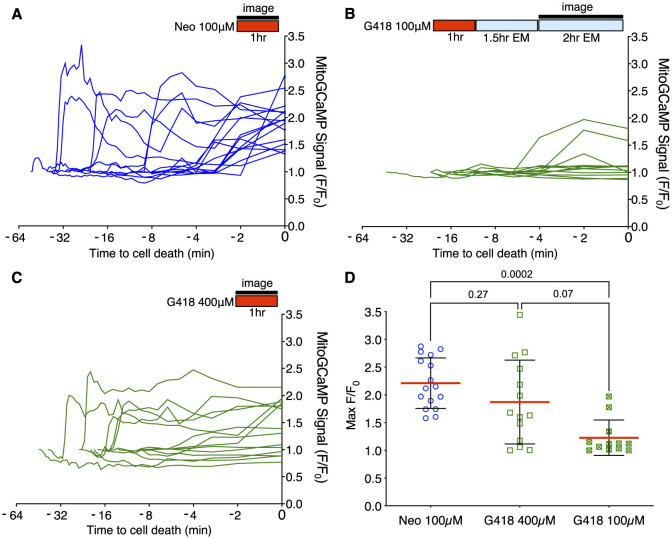
Different mitochondrial Ca2+ responses during acute or delayed hair cell death. (A–C) Fish were incubated in AG (red bar) for time indicated, or rinsed into fresh medium (blue bar). Fluorescence changes above baseline (F/F0) from mitoGCaMP in response to AG addition were monitored at 30 s intervals by spinning disk microscopy over the interval indicated (black bar). Individual traces represent responses of individual cells. Traces are aligned to time of cell fragmentation. (A) Changes in mitoGCaMP signal in cells undergoing acute death in response to 100 μM neomycin. Hair cells were imaged during the 1st h of neomycin exposure. Increases in mitochondrial Ca2+ were observed in 16/16 dying cells. (B) Changes in mitoGCaMP signal in cells undergoing delayed death after exposure to 100 μM G418. Cells were exposed to G418 for 1 h followed by rinse and incubation in fresh embryo medium (EM) for 1.5 h, and then imaged over an additional 2 h period. Increases in mitochondrial Ca2+ were observed in 2/11 dying cells. (C) Changes in mitoGCaMP signal in cells undergoing acute death in response to 400 μM G418. Hair cells were imaged during the 1st h of G418 exposure. Increases in mitochondrial Ca2+ were observed in 10/14 dying cells. (D) Maximum mitoGCaMP signal compared to baseline for dying cells after neomycin or G418 exposure. P-values from Kruskal-Wallis with Dunn's multiple comparison test. Error bars represent Standard Deviation.

Acknowledgments
This image is the copyrighted work of the attributed author or publisher, and ZFIN has permission only to display this image to its users. Additional permissions should be obtained from the applicable author or publisher of the image. Full text @ Front Neurol