
|
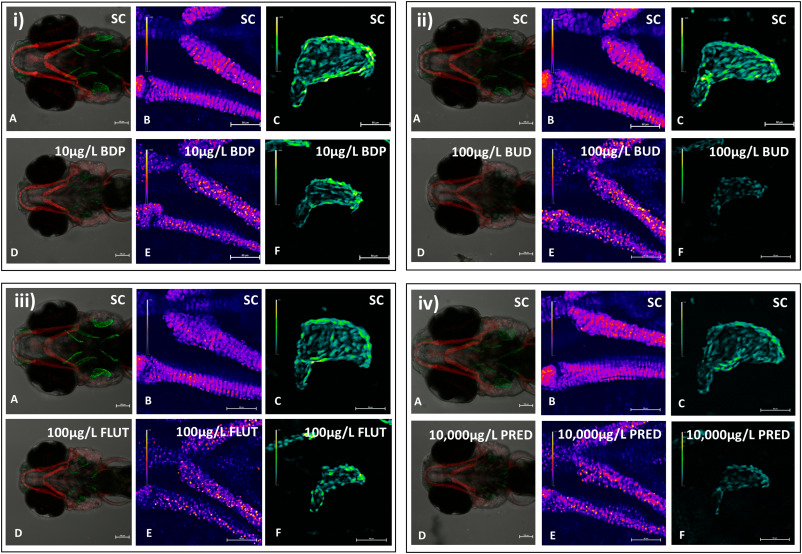
Fig. 4 Confocal Images of the cellular level organisation in lower jaw cartilage (Col2a1aBAC:mCherry) and opercle bone (sp7:EGFP) of 10 dpf embryo-larvae exposed to: i) BDP; ii) BUD; iii) FLUT; and iv) PRED for 10 days. Within each panel confocal maximum intensity projection images from a typical solvent control fish are shown of the: A) head with red fluorescent-labelled cartilage and green fluorescent-labelled bone of the lower jaw; B) a close up of the cellular level organisation of the front lower jaw cartilage coloured using a red (Fire) look up table in which the highest fluorescence intensity is represented by white, medium progressively by yellow, orange and red, and the lowest by dark purple (see key to left side of images); and C) a close up of the cellular level organisation of the opercle bone coloured using a green (Fire) look up table in which the highest fluorescence intensity is represented by white, medium progressively by yellow and paler greens and the lowest by dark green (see key to left side of images). Corresponding images are shown for a typical glucocorticoid-exposed individual in images D), E) and F), respectively. Scale bars are shown for sizing on each image. Note normal cellular level organisation in the cartilage and bone of solvent control animals, but the disorganisation (irregular stacking and rounding of cell bodies) of chondrocyte deposition shown in all glucocorticoid exposed animals, and the underdevelopment of the opercle bone (although cellular level organisation of osteoblasts appeared normal).