IMAGE

Figure 6

ID
ZDB-IMAGE-241127-77
Source
Figures for Zheng et al., 2024
Image
Figure Caption

Figure 6

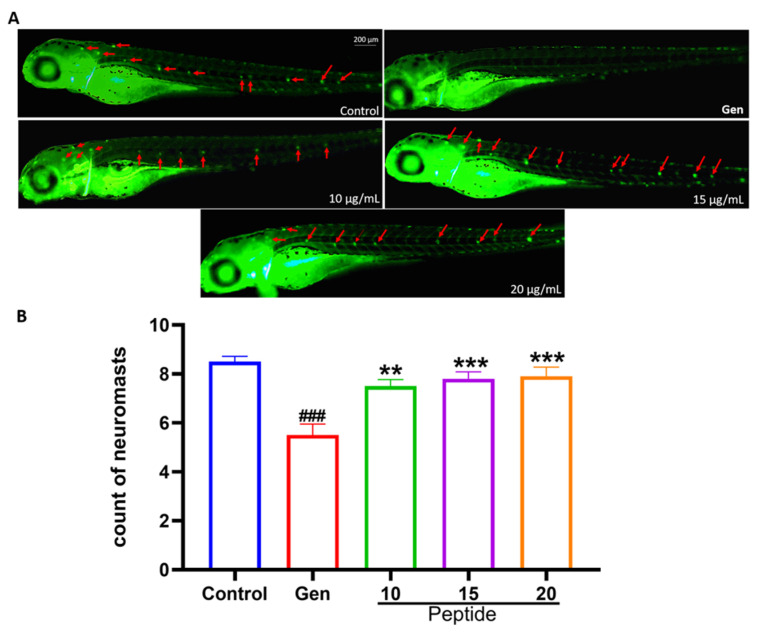
Effect of the peptide on mPTP in hair cells. (A) The state of mPTP in the hair cells is indicated by calcein (red arrows). When mPTP was closed, calcein was loaded onto the mitochondria, resulting in the presentation of green fluorescence. When mPTP was open, calcein flowed out of the mitochondria into the cytoplasm, resulting in the disappearance of green fluorescence (scale bar = 200 μm). (B) Quantitative assay of the neuromasts exhibiting green fluorescence (n = 10). Compared with the control group, ### p < 0.001; compared with the Gen-only-treated group, ** p < 0.01 and *** p < 0.001. mPTP, mitochondrial permeability transition pore.

Acknowledgments
This image is the copyrighted work of the attributed author or publisher, and ZFIN has permission only to display this image to its users. Additional permissions should be obtained from the applicable author or publisher of the image. Full text @ Mar. Drugs