IMAGE

Figure 8

ID
ZDB-IMAGE-241127-70
Source
Figures for Zang et al., 2024
Image
Figure Caption

Figure 8

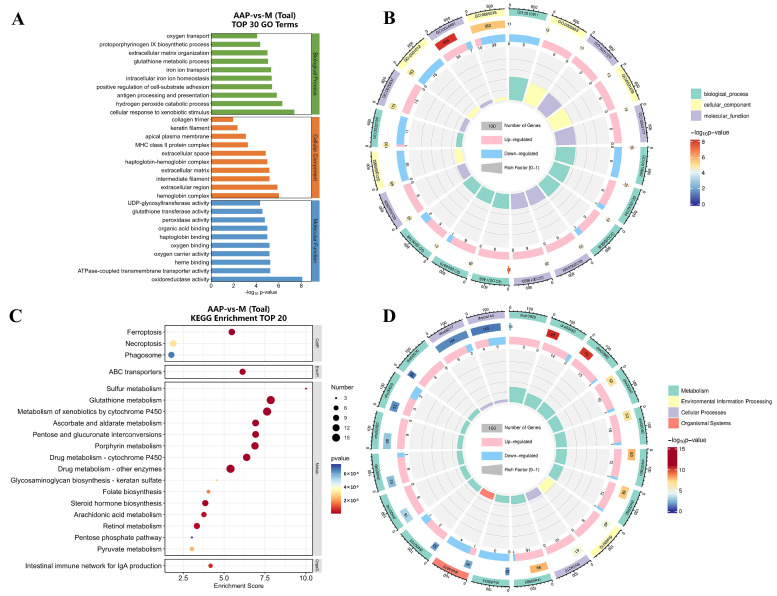
Enrichment analysis. (A) Top 30 GO terms in AAP-vs.-M. (B) GO analysis radar chart in AAP-vs.-M. The first circle represents the items of GO enrichment, and the outside of the circle represents a ruler with respect to gene number. Different colors represent different GO classifications. The second circle represents the number of genes enriched in the GO terms, and the color indicates the p value; the greater the number of genes, the longer the bar, and the smaller the p value, the redder the color. The third circle represents gene expression trends. (C) Top 20 pathways enriched in the AAP-vs.-M comparison. (D) KEGG analysis radar chart of the AAP-vs.-M comparison.

Acknowledgments
This image is the copyrighted work of the attributed author or publisher, and ZFIN has permission only to display this image to its users. Additional permissions should be obtained from the applicable author or publisher of the image. Full text @ Mar. Drugs