
Image
|
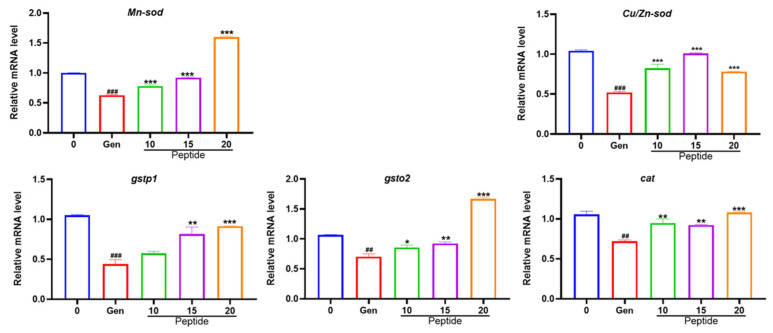
Figure Caption
Figure 7
Transcriptional alterations of genes. The amount of gene expression is exhibited as the relative expression. Compared with the control group, ##
Acknowledgments
This image is the copyrighted work of the attributed author or publisher, and
ZFIN has permission only to display this image to its users.
Additional permissions should be obtained from the applicable author or publisher of the image.
Full text @ Mar. Drugs