
|
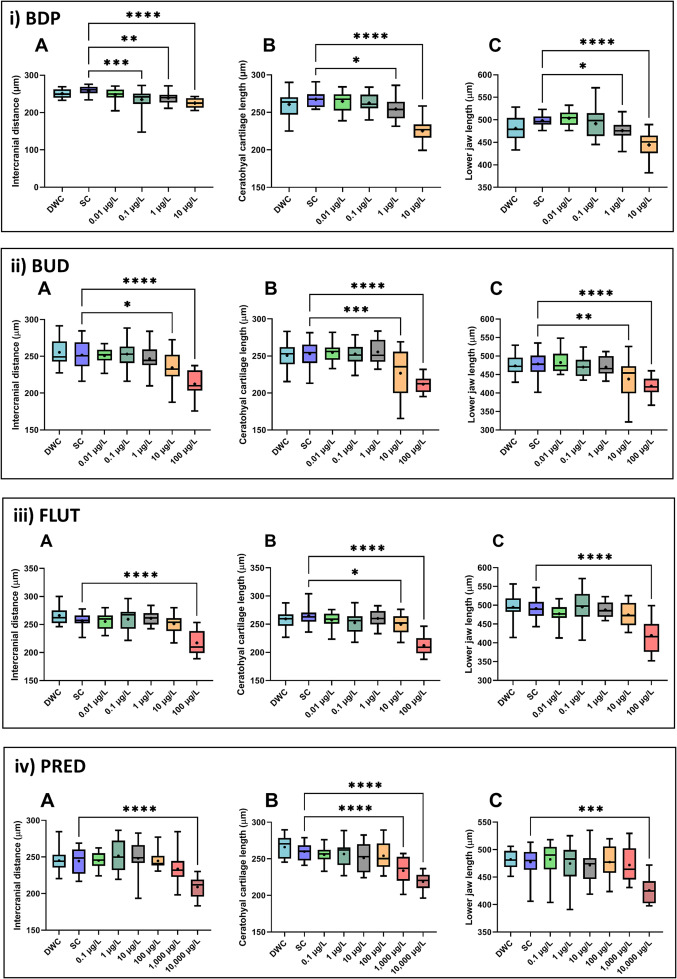
Fig. 2 Summary of the results for the measured lower jaw cartilage length in 10 dpf embryo-larvae exposed to: i) BDP; ii) BUD; iii) FLUT; and iv) PRED for 10 days. Within each panel are shown the following: A) Intercranial distance; B) Ceratohyal cartilage length; and C) Lower jaw length. In all cases, box and whiskers plots show the following: box range = 25th and 75th percentiles, line = median, + = mean, error bars = min to max values (n = 16 for all data sets). Data were analysed using a one-way ANOVA with Dunnett's multiple comparison test and statistically significant values (as compared to SC) are reported by * (P < 0.05), ** (P < 0.01), *** (P < 0.001) and **** (P < 0.0001).