IMAGE

Fig. 5

ID
ZDB-IMAGE-241123-5
Source
Figures for Ma et al., 2024
Image
Figure Caption

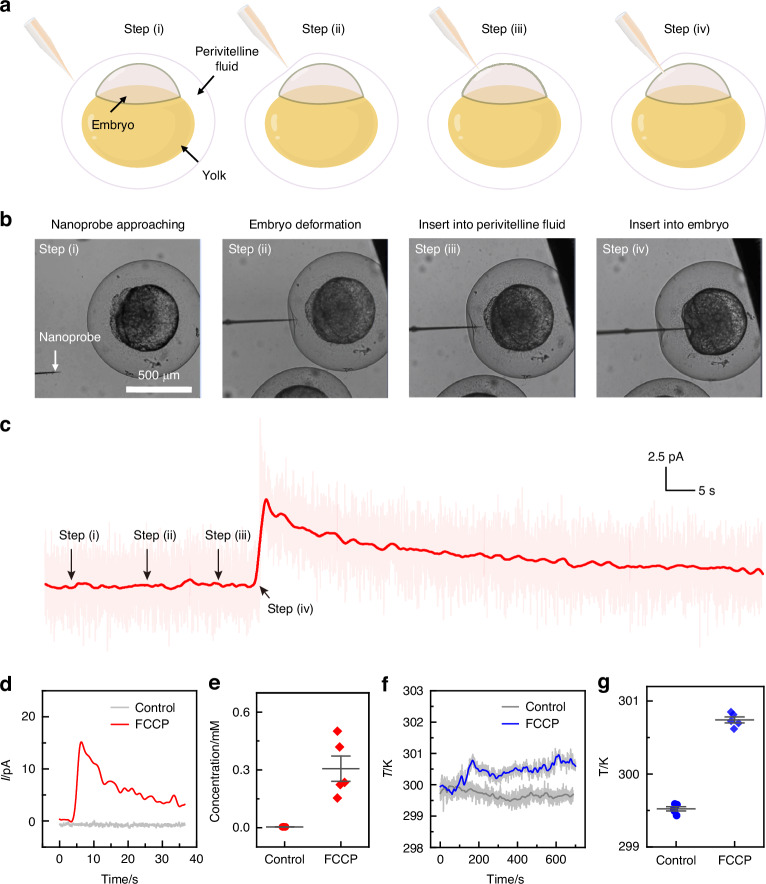
Fig. 5 Measurement of ROS and temperature in zebrafish embryos under mitochondrial toxic stress.

a Schematic illustration of the experimental process for measurement, including steps: (i) nanoprobe approaching the embryo, (ii) embryo deformation, (iii) insertion into the perivitelline fluid, (iv) insertion into the embryo. b Corresponding bright-field images of a zebrafish embryo measured at each step in (a). c Current trace corresponding to ROS detection in a zebrafish embryo measured at each step described in (a). d Current traces collected from the nanoprobe after penetrating single zebrafish embryos treated with FCCP and a control group (no FCCP), with an applied potential of 0.85 V. e Comparison of ROS concentration in five zebrafish embryos from the FCCP-treated group and the control group. f Time variation of temperature traces measured in zebrafish embryos after FCCP treatment and in the control group. g Comparison of temperature in five zebrafish embryos from the FCCP-treated group and the control group

Acknowledgments
This image is the copyrighted work of the attributed author or publisher, and ZFIN has permission only to display this image to its users. Additional permissions should be obtained from the applicable author or publisher of the image. Full text @ Microsyst Nanoeng