
|
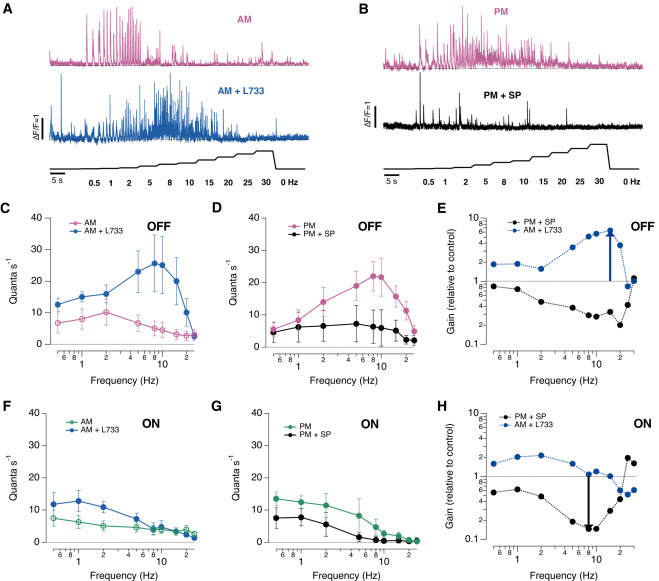
Fig. 3 Substance P regulates temporal filtering of the signal transmitted to the inner retina (A) Example of iGluSnFR signals from individual OFF synapses stimulated at a range of frequencies, from 0.5 to 30 Hz before (pink trace) and after injection of the NK1R antagonist L-733,060 (∼20 nM; blue trace). Recorded in the morning (60% contrast). (B) Example of iGluSnFR signals from individual OFF synapses before and after injection of substance P (∼20 nM) in the afternoon. (C) Frequency response of OFF synapses in the morning (n = 6), before and after injection of L-733,060. Each point shows the mean ± SEM. (D) Frequency response of OFF synapses in the afternoon (n = 6), before and after injection of substance P. (E) The relative change in gain of OFF synapses in (C) and (D). The maximum suppression caused by endogenous substance P was ∼6-fold at frequencies of ∼10–15 Hz (blue arrow). (F and G) As in (C) and (D), but in ON synapses (n = 4 in each graph). (H) The relative change in gain of ON synapses in (F) and (G). The maximum suppression caused by adding substance P was ∼6.8-fold at a frequency of ∼8–10 Hz (black arrow).