
|
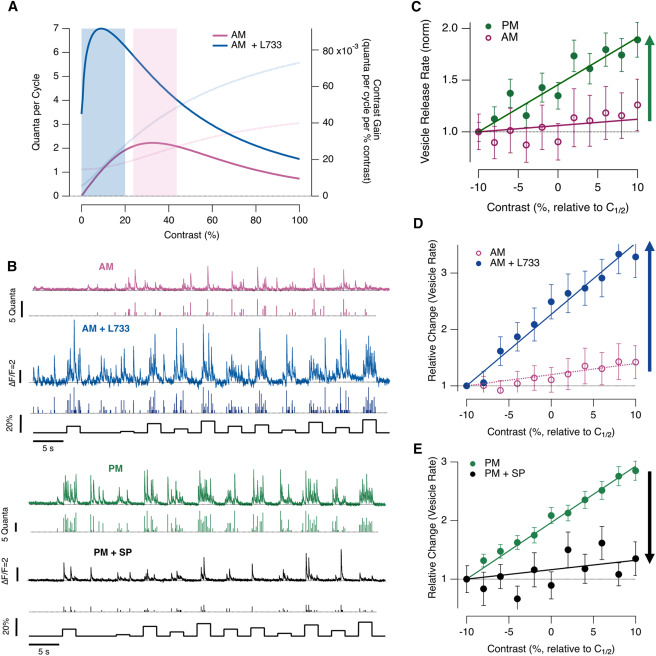
Fig. 4 Modulation of contrast gain by substance P (A) Contrast gain in OFF synapses in the morning before (pink) and after (blue) injection of NK1R antagonist L-733,060, calculated as the derivative of the fit to the contrast-response function in Figure 1E (fainter lines). Coding by rate and amplitude was investigated over a 20% range centered on the peak, as shown by bars. (B) Example of the stimulus protocol in which a set of 11 different contrasts were delivered in a pseudo-random sequence. In each color, the top trace is the iGluSFR signal and the lower one the estimated number of quanta in each event. Upper: responses in the morning before (pink) and after (blue) injection of L-733,060. Lower: responses in afternoon before (green) and after (black) injection of substance P. (C) The relative change in the rate of vesicle release over the 20% range of contrasts where the contrast sensitivity was highest. Lines fitted to points have slopes of: morning (pink, n = 25), 0.006 ± 0.006; afternoon (green, n = 65), 0.046 ± 0.004 (green arrow). Each point shows the mean ± SEM. (D) As (C), but comparing contrast gain in the morning before (pink, as in C) and after (blue, n = 11, 0.100 ± 0.002) antagonizing endogenous substance P (blue arrow). (E) As (C), but comparing contrast gain in the afternoon before (green, n = 65, slope = 0.046 ± 0.004) and after (black, n = 11, slope = 0.012 ± 0.006) injection of substance P (black arrow). See also Figure S3.