
|
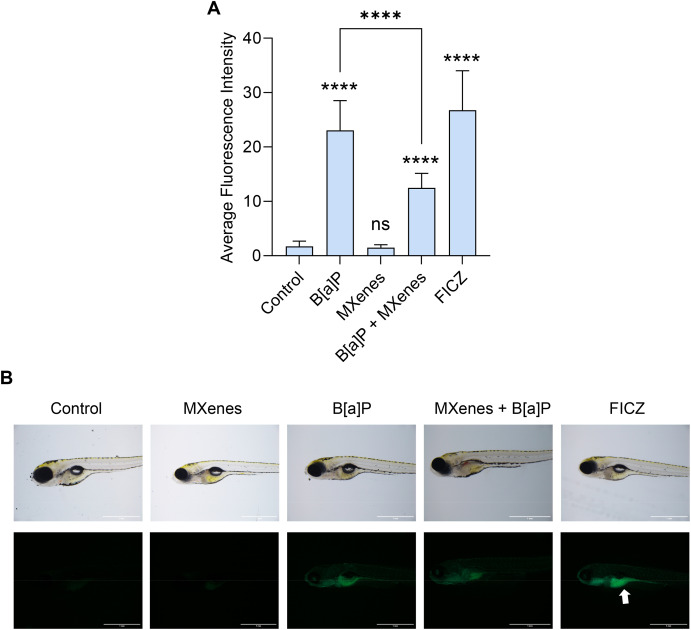
Fig. 6 Monitoring cyp1a induction using transgenic zebrafish. (A) The average fluorescence intensity in eGFP:cyp1a transgenic zebrafish embryos after exposure for 24 h to MXenes (80 mg/L), B[a]P (1 mg/L), and FICZ (1 μM) (25 individuals per sample). Data are presented as mean values ± S.D. of three independent experiments. One-way ANOVA with Tukey's multiple comparison test was used to analyze statistical differences between the exposures (∗p < 0.05, ∗∗p < 0.01, ∗∗∗p < 0.001, ∗∗∗∗p < 0.0001). (B) Representative fluorescence images of eGFP:cyp1a transgenic zebrafish embryos after 24 h of exposure to MXenes (80 mg/L), B[a]P (1 mg/L), and FICZ (1 μM) (positive control). The white arrow marks the gut. Scale bars in all panels: 1 mm.