
|
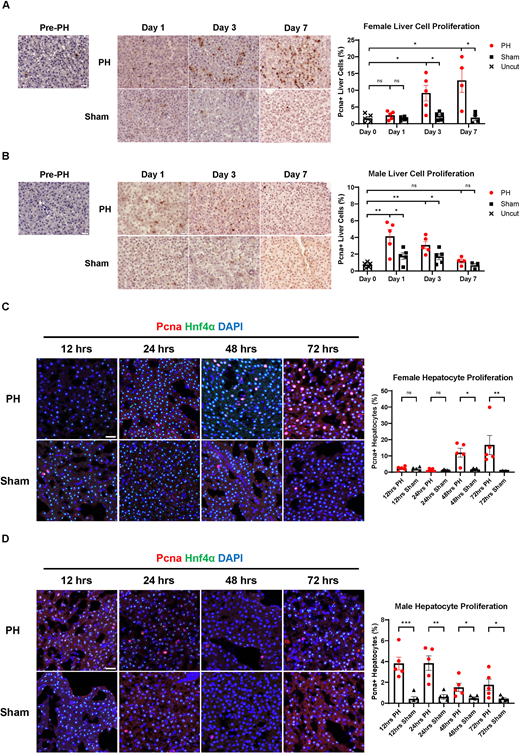
Fig. 2 Sex disparity in liver cell proliferation during PH-induced zebrafish liver regeneration. (A) Immunohistochemical (IHC) staining of Pcna in female zebrafish livers before and after PH or sham surgery. Quantification of Pcna+ proliferating liver cells is shown on the right. Each symbol represents one zebrafish. (B) IHC staining of Pcna in male zebrafish livers before and after PH or sham surgery. Quantification of Pcna+ proliferating liver cells is shown on the right. Each symbol represents one zebrafish. (C) Immunofluorescence (IF) staining of Pcna and Hnf4α in female zebrafish livers following PH or sham surgery. Quantification of Pcna and Hnf4α double-positive proliferating hepatocytes is shown on the right. Each symbol represents one zebrafish. (D) IF staining of Pcna and Hnf4α in male zebrafish livers following PH or sham surgery. Quantification of Pcna and Hnf4α double-positive proliferating hepatocytes is shown on the right. Each symbol represents one zebrafish. Scale bars: 20 μm. ns, not significant (P>0.05); *P≤0.05, **P≤0.01, ***P≤0.001 (two-tailed unpaired Student's t-test).