
|
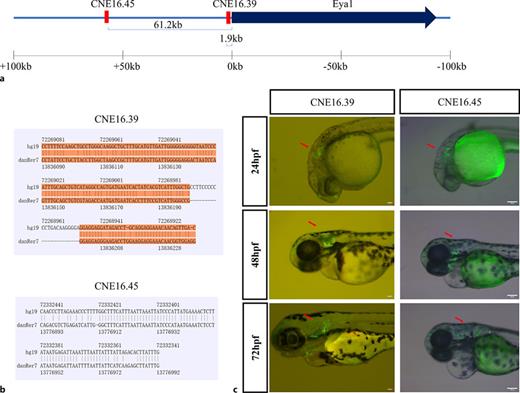
Fig. 2 Identification of tissue-specific CNEs around eya1 gene. a CNEs distribution near the zebrafish eya1 locus based on the danRer7 assembly. Genes are shown as blue rectangles and the orientation of arrows indicates the translational initiation sites of genes. The CNEs located near the eya1 gene are indicated by red rectangles. The horizontal line at the bottom indicates the studied range of the DNA sequence range. b Sequence conservation between zebrafish (danRer7 assembly) and humans (hg19 assembly). c CNE16.39 and CNE 16.45 regulate GFP expression mainly in zebrafish ear. Photos were taken with the GFP channel at 24 hpf, 48 hpf, and 72 hpf. Red arrow, location of ear.