IMAGE

Figure 2

ID
ZDB-IMAGE-241018-15
Source
Figures for Crilly et al., 2024
Image
Figure Caption

Figure 2

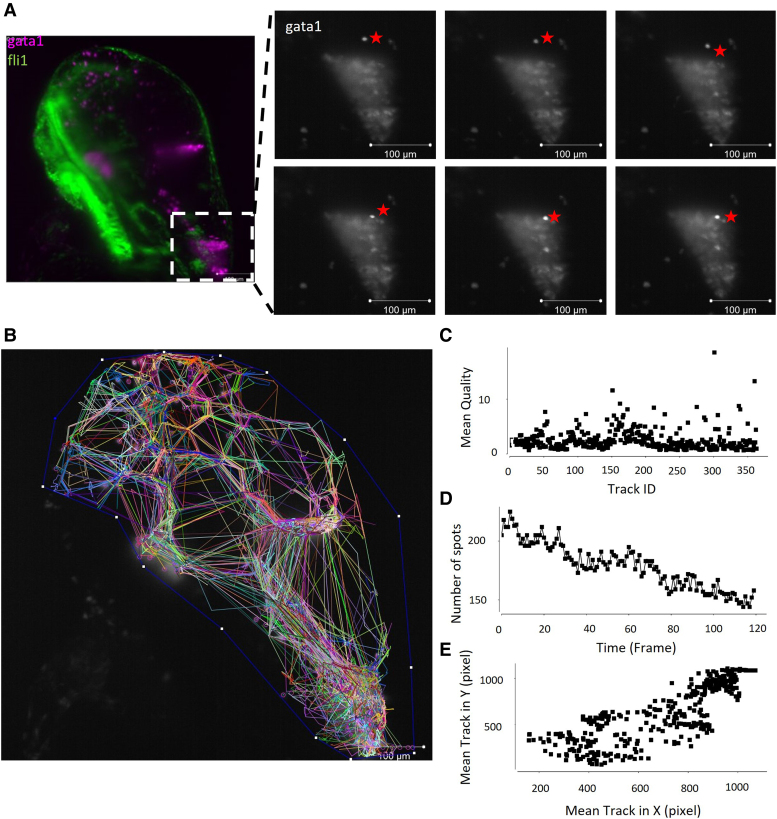
Live time lapse imaging shows RBCs moving through the ventricular system. A live fli1:EGFP;gata1:DsRed (endothelial cells, RBCs) transgenic larva were imaged over time to obtain a time lapse video (Video 1). (A) Still image from Video 1 (with false colour overlay) showing the location from the magnified insets. A gata1 positive RBC, denoted by a star, is observed in the hindbrain tissue and moves over the course of six frames (∼30 min) into the cluster of RBCs observed in the hindbrain ventricle. Scale bar = 100 µm. (B) Tracks of each gata1 positive cell over time show an overall migration to the hindbrain ventricle and movement within the haematoma. (C) The average automated detection quality was similar between the different cell tracks, one data point per cell. (D) Total number of cells identified (spots) decreased over the course of the time-lapse with the death of RBCs and the loss of gata1 fluorescence. (E) Average X movement versus average Y movement from each cell (spot) shows a high density of tracks migrating to the bottom right of the image, where the hindbrain ventricle is located.

Acknowledgments
This image is the copyrighted work of the attributed author or publisher, and ZFIN has permission only to display this image to its users. Additional permissions should be obtained from the applicable author or publisher of the image. Full text @ Brain Commun