
Figure 5
- ID
- ZDB-IMAGE-241017-57
- Publication
- Massoz et al., 2024 - Negative cell cycle regulation by calcineurin is necessary for proper beta cell regeneration in zebrafish
- All Figures
- Figures for Massoz et al., 2024
|
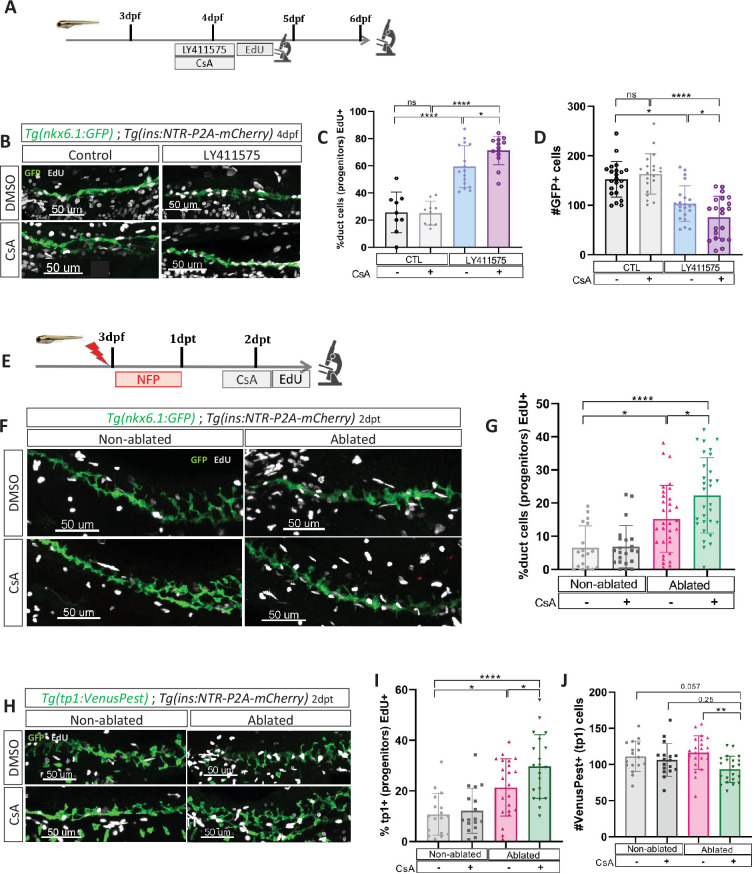
Figure 5 Calcineurin (CaN) repression increases the proportion of ductal proliferating cells. (A) Experimental design for 5‐ethynyl‐2′‐deoxyuridine (EdU) assay in Notch test. Larvae were treated concomitantly with LY411575 (Notch inhibitor) and Cyclosporin A (CsA) from 3 to 4 dpf and then briefly treated with EdU before fixation and analysis at 4 or 6 dpf. (B) Whole mount fluorescent immunohistochemistry (GFP and EdU) of the pancreatic tail of Tg(ins:NTR-P2A-mCherry); Tg(nkx6.1:GFP) larvae at 4 dpf. 3D projection (stack) of one control (without any treatment), one with CsA only, one with LY411575 only and one with both CsA and LY411757 representative samples. Scale 50 µM. (C) Barplot representing the percentage of GFP+ ductal cells which incorporated EdU+ in pancreatic tail of Tg(ins:NTR-P2A-mCherry); Tg(nkx6.1:GFP) larvae for the Notch test. The black dots represent the control (n=9); gray CsA treatment (n=10); blue LY411575 (n=16); and purple combination of LY411575 and CsA (n=16). Data are presented as mean values ± standard deviation (SD). T-test. Two-way ANOVA test with Tukey’s multiple comparisons test, *p-value <0.05; ****p-value <0.00005; ns = non-significant. The experiment was performed at least two times. (D) Barplot representing the number of GFP+ ductal cells which in pancreatic tail of Tg(ins:NTR-P2A-mCherry); Tg(nkx6.1:GFP) larvae at 6 dpf for the Notch test. The black dots represent the control (n=22); gray CsA treatment (n=20); blue LY411575 (n=21); and purple combination of LY411575 and CsA (n=21). Data are presented as mean values ± SD. T-test. Two-way ANOVA test with Tukey’s multiple comparisons test, *p-value <0.05; ****p-value <0.00005; ns = non-significant. The experiment was performed at least two times and the data are combined in the graph. (E) Experimental design for EdU assay in regeneration. Larvae were treated with nifurpirinol for beta cell ablation from 3 to 4 dpf then with CsA from 4 to 5 dpf and then briefly treated with EdU before fixation and analysis. (F) Whole mount fluorescent immunohistochemistry (GFP and EdU) of the pancreatic tail of Tg(ins:NTR-P2A-mCherry); Tg(nkx6.1:GFP) larvae at 5 dpf. 3D projection (stack) of one representative sample of non-ablated or ablated with or without CsA are shown. Scale 50 µM. (G) Barplot representing the percentage of GFP+ ductal cells which incorporated EdU+ in pancreatic tail of Tg(ins:NTR-P2A-mCherry); Tg(nkx6.1:GFP) larvae at 5 dpf. The gray spheres represent non-ablated condition (n=18); the pink triangles the ablated condition (n=32); the black squares CsA condition (n=22) and inverted green triangles ablated + CsA condition (n=30). Data are presented as mean values ± SD. Two-way ANOVA test with Tukey’s multiple comparisons test, *p-value <0.05; ****p-value <0.00005; ns = non-significant. The experiment was performed at least two times and the data are combined in the graph. (H) Whole mount fluorescent immunohistochemistry (VenusPest and EdU) of the pancreatic tail of Tg(ins:NTR-P2A-mCherry); Tg(tp1:VenusPest) larvae at 5 dpf. 3D projection (stack) of one representative sample of non-ablated or ablated with or without CsA are shown. Scale 50 µM. (I) Barplot representing the percentage of GFP+ ductal cells which incorporated EdU+ in pancreatic tail of Tg(ins:NTR-P2A-mCherry); Tg(tp1:VenusPest) larvae at 5 dpf. The gray spheres represent non-ablated condition (n=17); the pink triangles the ablated condition (n=22); the black squares CsA condition (n=18) and inverted green triangles ablated + CsA condition (n=20). Data are presented as mean values ± SD. Two-way ANOVA test with Tukey multiple comparisons test, *p-value <0.05; ****p-value <0.00005; ns means non-significant. The experiment was performed at least two times and the data are combined in the graph. (J) Barplot representing the number of VenusPest+ ductal cells which incorporated EdU+ in pancreatic tail of Tg(ins:NTR-P2A-mCherry); Tg(tp1:VenusPest) larvae at 5 dpf. The gray spheres represent non-ablated condition (n=17); the pink triangles the ablated condition (n=21); the black squares CsA condition (n=17) and inverted green triangles ablated + CsA condition (n=21). Data are presented as mean values ± SD. Two-way ANOVA test with Tukey’s multiple comparisons test, **p-value <0.005. The experiment was performed at least two times and the data are combined in the graph.