IMAGE

Figure 3.

ID
ZDB-IMAGE-241017-54
Source
Figures for Massoz et al., 2024
Image
Figure Caption

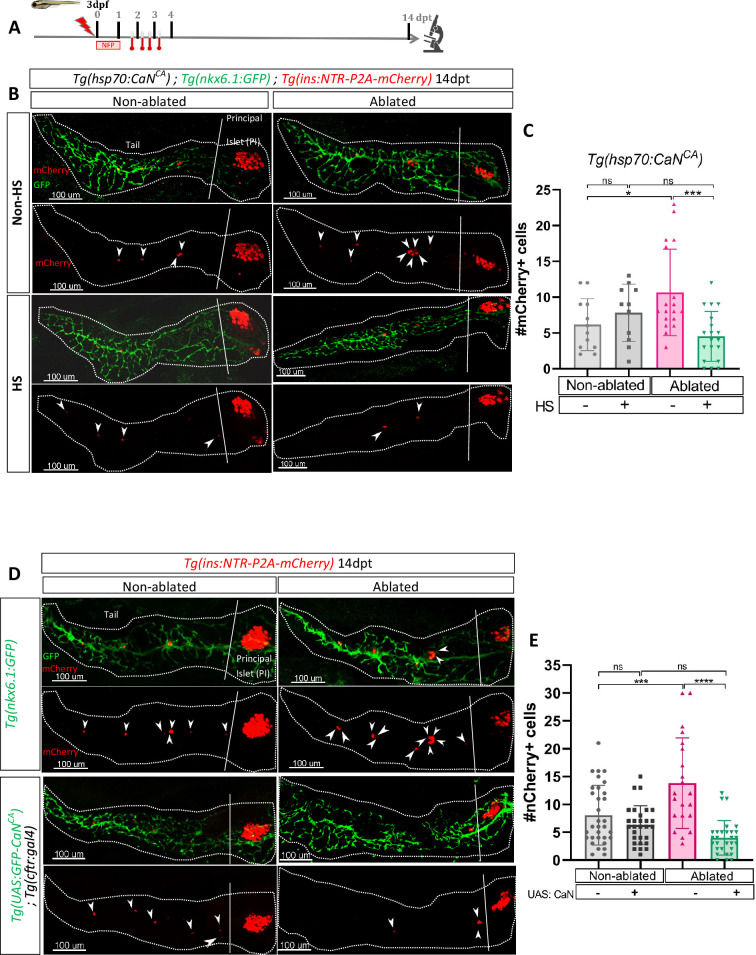
Figure 3. Transgenic mediated overexpression of calcineurin abolish the ductal regenerative response.

(A) Experimental design for regeneration test in larvae with heat-shocks. Briefly, after nifurpirinol treatment from 3 to 4 dpf, four heat-shock were performed from 1 to 3 dpt and larvae were fixed and analyzed at 14 dpt. (B) Whole mount fluorescent immunohistochemistry (GFP and mCherry) of the pancreas of Tg(hsp70:CaNCA); Tg(ins:NTR-P2A-mCherry); Tg(nkx6.1:GFP) larvae at 14 dpt. 3D projection (stack) of one non-ablated and one ablated with or without heat-shock representative samples. The principal islet (PI) and the pancreatic tail are showed. Arrows point out mCherry+ beta cells in the pancreatic tail. Scale 100 µM. (C) Barplot representing the mean number of mCherry+ beta cells in the pancreatic tail of Tg(hsp70:CaNCA); Tg(ins:NTR-P2A-mCherry); Tg(nkx6.1:GFP) larvae at 14 dpt. The gray spheres represent non-ablated condition (n=12); the pink triangles represent the ablated condition (n=18); the black squares heat-shock condition (n=11) and inverted green triangles ablated + heat-shock condition (n=19). Data are presented as mean values ± standard deviation (SD). Two-way ANOVA with Tukey’s multiple comparisons test, *p-value <0.05, ***p-value <0.0005, ns = non-significant. The experiment was performed at least two times and the data are combined in the graph. (D) Whole mount fluorescent immunohistochemistry (GFP and mCherry) of the pancreas of larvae at 14 dpt. 3D projection (stack) of Tg(ins:NTR-P2A-mCherry); Tg(nkx6.1:GFP) one non-ablated and one ablated representative control samples and Tg(UAS:CaNCA); Tg(ins:NTR-P2A-mCherry); Tg(cftr:gal4) one non-ablated and one ablated representative samples. The principal islet (PI) and the pancreatic tail are showed. Arrows point out mCherry+ beta cells in the pancreatic tail. Scale 100 µM. (E) Barplot representing the mean number of mCherry+ beta cells in the pancreatic tail of larvae at 14 dpt. The gray spheres represent non-ablated Tg(ins:NTR-P2A-mCherry); Tg(nkx6.1:GFP) condition (n=31); the pink triangles represent the ablated Tg(ins:NTR-P2A-mCherry); Tg(nkx6.1:GFP) condition (n=21); the black squares non-ablated Tg(UAS:CaNCA); Tg(ins:NTR-P2A-mCherry); Tg(cftr:gal4) condition (n=29) and inverted green triangles ablated Tg(UAS:CaNCA); Tg(ins:NTR-P2A-mCherry); Tg(cftr:gal4) condition. Data are presented as mean values ± SD. Two-way ANOVA with Tukey’s multiple comparison test, ***p-value <0.0005, ****p-value <0.00005, ns = non-significant. The experiment was performed at least two times and the data are combined in the graph.

Acknowledgments
This image is the copyrighted work of the attributed author or publisher, and ZFIN has permission only to display this image to its users. Additional permissions should be obtained from the applicable author or publisher of the image. Full text @ Elife