
|
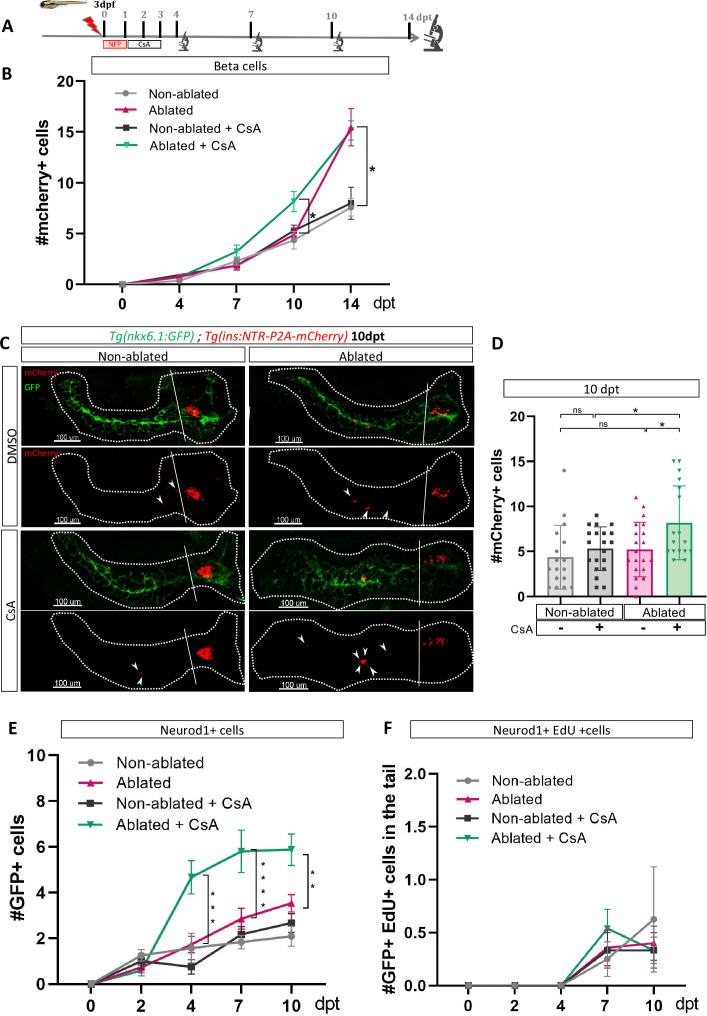
Figure 2 Calcineurin inhibition with Cyclosporin A (CsA) increases the ductal regenerative response. (A) Experimental design for regeneration test in larvae with CsA treatment. Briefly, after nifurpirinol treatment from 3 to 4 dpf, larvae were treated with CsA from 1 to 3 dpt and fixed and analyzed at 4–7–10 and 14 days post treatment (dpt). The experiment was performed at least two times and the data are combined in these graphs. (B) Graph representing the mean number of mCherry+ beta cells in the pancreatic tail of Tg(ins:NTR-P2A-mCherry); Tg(nkx6.1:GFP) at 0–4–7–10 and 14 dpt. The gray spheres represent non-ablated condition; the pink triangles represent the ablated condition; the black squares CsA condition and inverted green triangles ablated + CsA condition. Data are presented as mean values ± SEM. Two-way ANOVA test with Sidak’s multiple comparisons test, *p-value <0.05. (C) Whole mount fluorescent immunohistochemistry (GFP and mCherry) of the pancreas of Tg(ins:NTR-P2A-mCherry); Tg(nkx6.1:GFP) larvae at 10 dpt. 3D projection (stack) of non-ablated and ablated larvae treated with DMSO or CsA representative samples. The principal islet (PI) and the pancreatic tail are shown. Arrows point out mCherry+ beta cells in the pancreatic tail. Scale 100 µM. (D) Barplot representing the number of number of mCherry+ beta cells in the pancreatic tail of Tg(ins:NTR-P2A-mCherry); Tg(nkx6.1:GFP) larvae at 10 dpt. The gray spheres represent non-ablated condition (n=17) ; the pink triangles represent the ablated condition (n=20); the black squares CsA condition (n=20) and inverted green triangles ablated + CsA condition (n=17). Data are presented as mean values ± standard deviation (SD). Two-way ANOVA with Tukey’s multiple comparison test, *p-value <0.05. (E) Graph representing the mean number of GFP+ neurod1+ cells in the pancreatic tail of Tg(ins:NTR-P2A-mCherry); Tg(neurod1:GFP) at 0–4–7 and 10 dpt. The gray spheres represent non-ablated condition; the pink triangles represent the ablated condition; the black squares CsA condition and inverted green triangles ablated + CsA condition. Data are presented as mean values ± SEM. Two-way ANOVA test with Sidak’s multiple comparisons test, **p-value <0.005; ***p-value <0.0005; ****p-value <0.00005. The experiment was performed at least two times and the data are combined in the graph. (F) Graph representing the mean number of GFP+ neurod1 EdU+ cells in the pancreatic tail of Tg(ins:NTR-P2A-mCherry); Tg(neurod1:GFP) at 0–4–7 and 10 dpt. The gray spheres represent non-ablated condition; the pink triangles represent the ablated condition; the black squares CsA condition and inverted green triangles ablated + CsA condition. Data are presented as mean values ± SEM.