
Image
|
Figure Caption
Figure 1
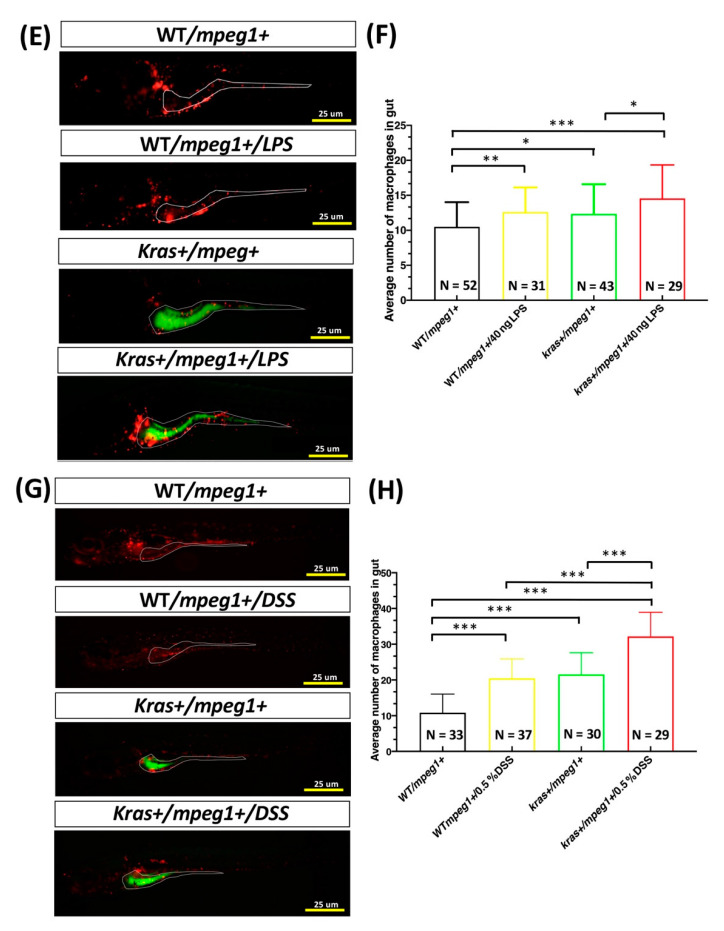
DSS or LPS enhances the increase in intestinal neutrophils and macrophages in kras+/lyz+ and kras+/mepg1+ zebrafish larvae. (A,C,E,G) Fluorescence of neutrophils and macrophages in the intestine. (B,D,F,H) Quantification of the number of positive cells as revealed by fluorescence of neutrophils or macrophages. Differences among the variables were assessed using Student’s t-tests. Statistical significance: * p < 0.05, ** p < 0.01, *** p < 0.001. Scale bar: 25 μm.
Figure Data
Acknowledgments
This image is the copyrighted work of the attributed author or publisher, and
ZFIN has permission only to display this image to its users.
Additional permissions should be obtained from the applicable author or publisher of the image.
Full text @ Biomedicines