
Image
|
Figure Caption
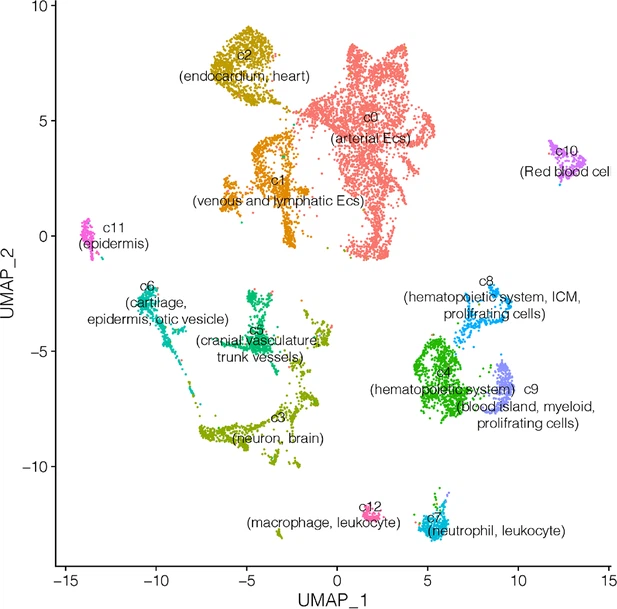
Fig. 4 - Supplemental 2 UMAP representation of endothelial cell (EC) subpopulations. All single cells (after filtering) from the control and D-glucose treated were included in this illustration.
Acknowledgments
This image is the copyrighted work of the attributed author or publisher, and
ZFIN has permission only to display this image to its users.
Additional permissions should be obtained from the applicable author or publisher of the image.
Full text @ Elife