
|
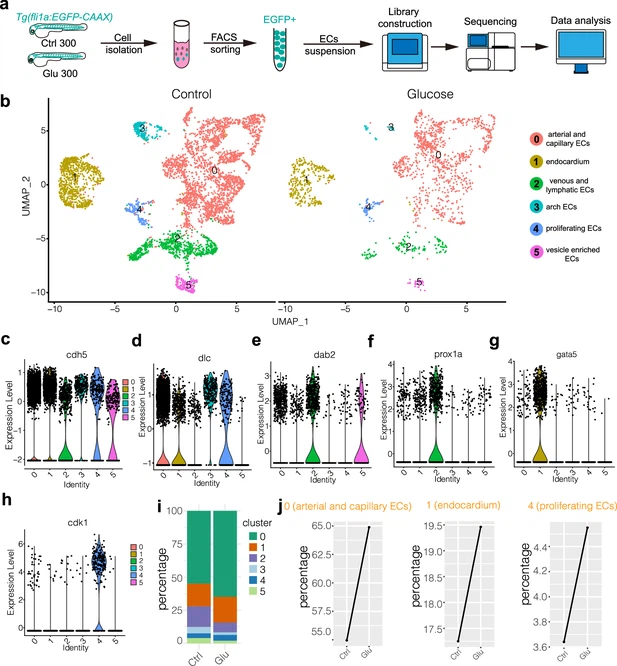
Fig. 4 Single-cell transcriptome sequencing analysis of endothelial cells (ECs) in control and high glucose-treated embryos. (a) Schematic diagram of the single-cell sequencing process. 300 embryos in the control group and 300 in the high glucose group were used, and ECs were sorted by GFP fluorescent using fluorescence-activated cell sorting (FACS) technology. (b) The measured cells were divided into six individual clusters based on gene expression profiles using UMAP. (c–h) The violin plots of some EC marker genes. (i) The proportion of ECs in each cluster of control and high glucose groups. (j) Changes of ECs percentage in arterial and capillary ECs, endocardium, and proliferating ECs of control and high glucose group.