
Image
|
Figure Caption
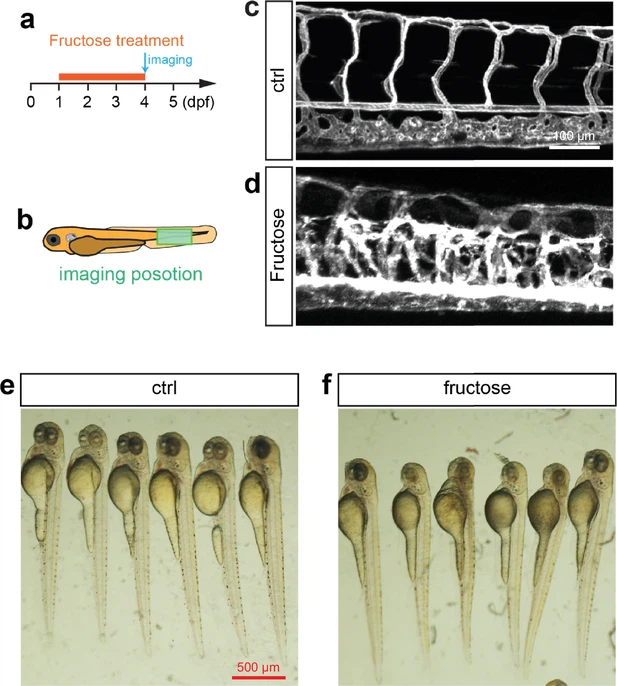
Fig. 2 - Supplemental 1 Fructose treatment caused excessive angiogenesis in zebrafish. (a) A diagram showing the fructose treatment time window and imaging time point. (b) A diagram indicating the imaging position of the zebrafish embryos. (c, d) Confocal imaging analysis of the control and glucose-treated Tg(fli1aEP:EGFP-CAAX)ntu666 embryos. (e, f) Imaging analysis of control and fructose-treated embryos in bright field.
Acknowledgments
This image is the copyrighted work of the attributed author or publisher, and
ZFIN has permission only to display this image to its users.
Additional permissions should be obtained from the applicable author or publisher of the image.
Full text @ Elife