
|
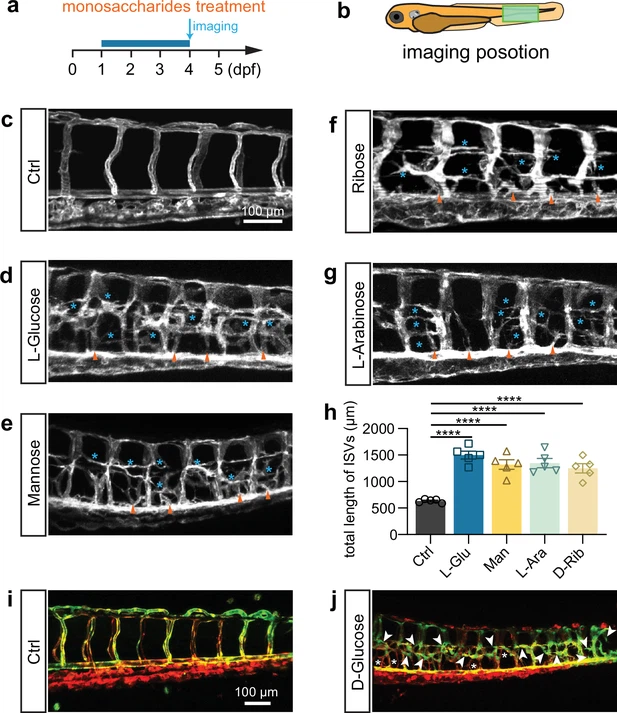
Fig. 2 L-Glucose and mannose treatment caused excessive angiogenesis as well. (a) A diagram showing the monosaccharides treatment time window and imaging time point. (b) A diagram indicating the imaging position of the zebrafish embryos. (c–g) Confocal imaging analysis of the control and monosaccharides, including L-glucose, D-mannose, D-ribose, and L-arabinose, treated embryos. Arrowheads indicate the ectopic branching from the dorsal aorta. Stars indicate the ectopic vessels from intersegmental vessels (ISVs). (h) Statistical analysis of the total length of ISVs in control and monosaccharides-treated embryos (n=5). (i, j) Confocal imaging analysis of the control and glucose-treated embryos. Arrowheads indicate the ectopic branching of arteries. Stars indicate the ectopic branching of veins. t-test, ****p<0.0001.