
Image
|
Figure Caption
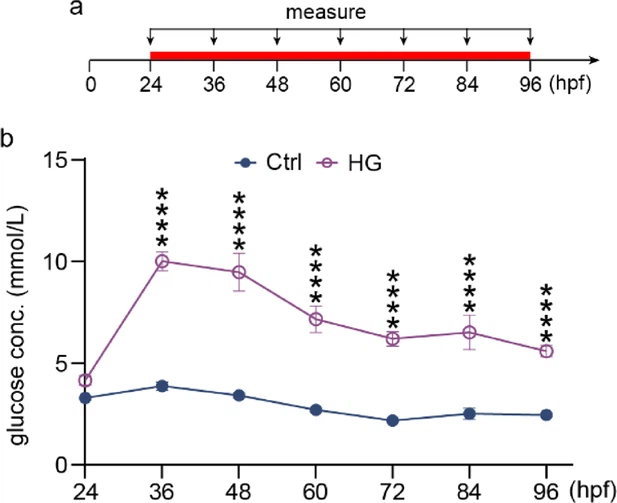
Fig. 1 - Supplemental 3 Total glucose concentrations at different development stages in control and high glucose-treated embryos. (a) A diagram showing the glucose treatment time window and concentration measuring time point. (b) Statistical analysis of the glucose concentration in control and high glucose-treated embryos. One-way ANOVA, ****p<0.0001.
Acknowledgments
This image is the copyrighted work of the attributed author or publisher, and
ZFIN has permission only to display this image to its users.
Additional permissions should be obtained from the applicable author or publisher of the image.
Full text @ Elife