
|
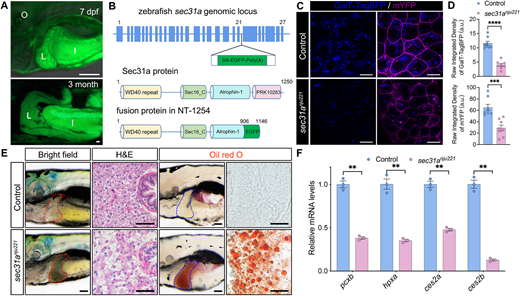
Fig. 1 Deficiency of COPII-mediated trafficking in sec31anju221 mutants leads to the development of hepatic steatosis. (A) GFP expression pattern in the zebrafish trapping line NT-1254 at the indicated stages. Lateral views, head to left. I, intestine; L, liver; O, otic capsule. Images are representative of eight fish at each stage. Scale bars: 200 μm. (B) Upper panel: zebrafish sec31a genomic locus. The transposon is inserted into the 21st intron. Lower panel: schematic representations of the domain structure of the zebrafish Sec31a protein and the fusion protein in NT-1254 fish. (C) Live-cell imaging of shield stage zebrafish embryos injected with the trans-Golgi network reporter GalT-BFP (blue) and the plasma membrane reporter mYFP (magenta). Scale bars: 20 μm. (D) Quantification of GalT-BFP and mYFP fluorescence intensity (n=6). a.u., arbitrary units. ***P<0.001; ****P<0.0001 (unpaired two-tailed Student's t-test). (E) Left: bright-field images depicting the liver of live zebrafish larvae. Middle: Hematoxylin and Eosin (H&E) staining of liver from 7 dpf zebrafish larvae. Right: Oil Red O staining of 7 dpf zebrafish larvae. For bright-field and ORO staining images, livers are outlined with dashed lines. Scale bars: 100 μm (bright-field images); 20 μm (H&E and Oil Red O images). Images are representative of 20 fish within each group. (F) Quantitative PCR analysis of RNA samples extracted from livers of 7 dpf larvae. Data are mean±s.e.m. **P<0.01 (unpaired two-tailed Student's t-test).