
Image
|
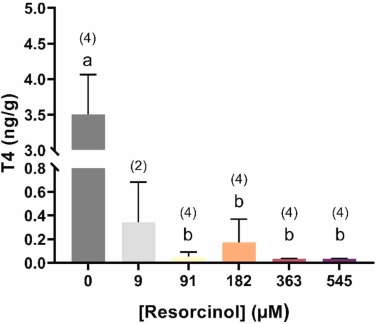
Figure Caption
Fig. 1 Effect of resorcinol exposure on whole-body T4 levels at 120 hpf. Average T4 levels following continuous resorcinol exposure. Error bars show standard deviation and sample sizes are given in parentheses. Each sample consisted of 100 pooled eleutheroembryos. Different letters indicate significant differences. Treatment 9 µM was left out of the statistical analysis because only two replicates were included (see Section 2.9).
Acknowledgments
This image is the copyrighted work of the attributed author or publisher, and
ZFIN has permission only to display this image to its users.
Additional permissions should be obtained from the applicable author or publisher of the image.
Full text @ Ecotoxicol. Environ. Saf.