
|
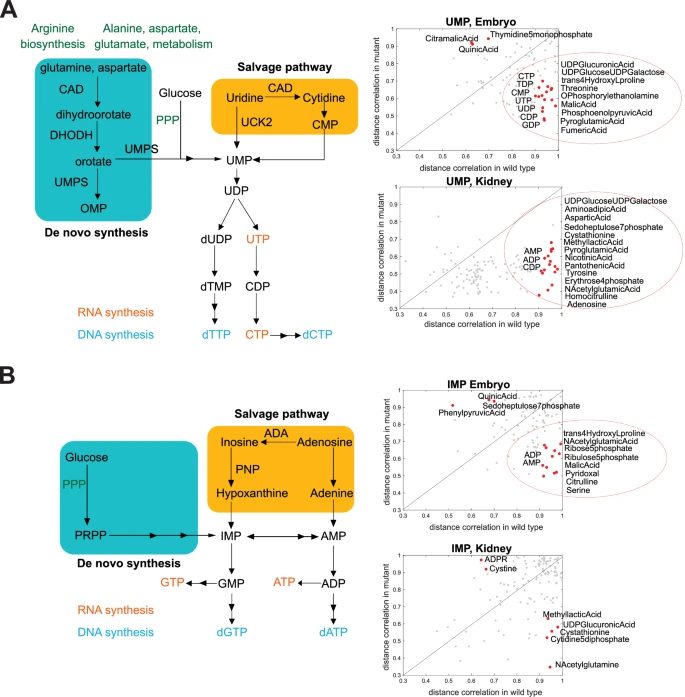
Fig. 7 Distance correlation analysis shows major changes in pyrimidine and purine metabolism.Schematic representations of de novo and salvage nucleotide biosynthesis are shown. Scatter plot graphs show distance correlations between (A) UMP or (B) IMP and all other metabolites measured. Correlation is calculated separately for wildtype and mutant fish. Separate analysis is done for embryo and kidney samples. Each point in the graph shows value in two groups of samples for a metabolite pair. Indicated in red and with metabolite names are correlations that show differences in wildtype and mutant animals (correlations that are very high, over 0.9 in one group of animals, and low, under 0.7 in the other group).