
|
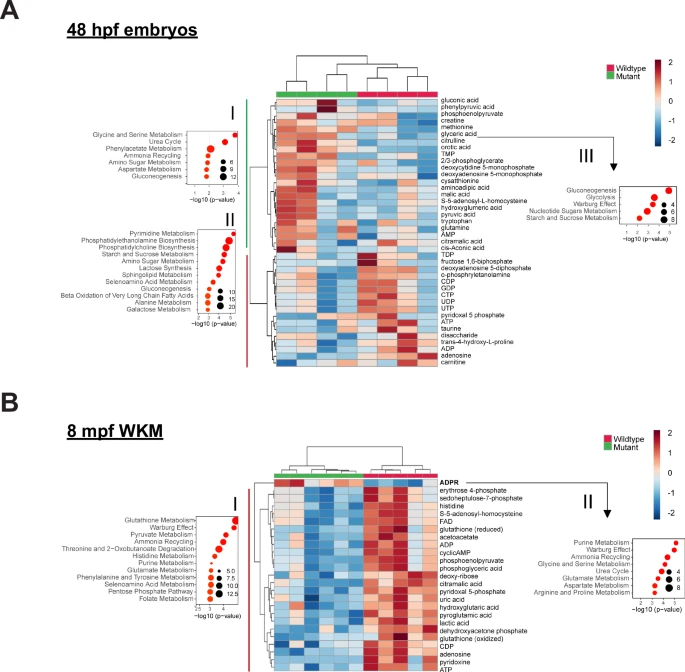
Fig. 6 Nucleotide metabolism is altered in dnajc21 mutants.Heatmaps show hierarchical clustering of selected set of altered metabolites in dnajc21−/− mutant vs. wildtype (A) embryos at 48 hpf and (B) whole kidney marrows (WKMs) at 8 mpf. Metabolites are selected based on t-test comparison. Pathway enrichment analysis is performed for subsets of metabolites showing higher concentration in (A.I) mutant embryos, (A.II) wildtype embryos, and (B.I) kidney samples. Analysis of pathway enrichment for correlation partners of the most significantly differentially concentrated metabolites in mutant and wildtype samples is shown in (A.III) for citrulline and orotic acid in mutant embryos and (B.II) ADPR for mutant kidney. Enrichment graphs show p-values on the x-axis and size of the bubble indicates the number of significantly altered metabolites for each pathway. FAD—flavin adenine dinucleotide; ADP—adenosine 5-diphosphate; cyclicAMP—adenosine 3-5-cyclic monophosphate; CDP—cytidine 5-diphosphate; CTP—cytidine 5-triphosphate; ATP—adenosine 5-triphosphate; AMP—adenosine 5-monophosphate; TMP—thimidine 5-monophosphate; DMP—deoxycytidine 5-monophosphate; ADPR—ADP-ribose. hpf: hours post-fertilization; mpf: months post-fertilization.