
|
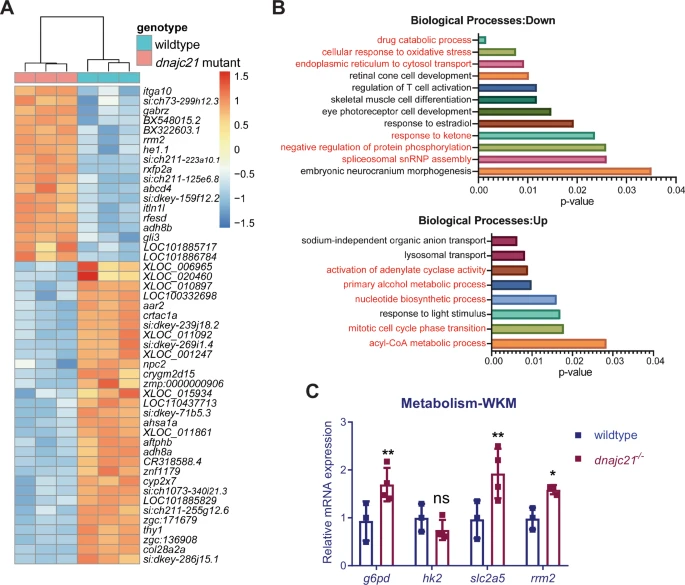
Fig. 5 RNA sequencing identifies various dysregulated metabolic pathways in dnajc21 mutants.A Heatmap shows hierarchical clustering of the top 50 differentially expressed genes in dnajc21−/− mutant vs. wildtype embryos. RNA sequencing was performed on pools of 30 embryos at 48 hours post-fertilization. B Gene ontology enrichment analysis showing top downregulated and upregulated biological processes. Processes related to metabolism, protein homeostasis, and cell proliferation are highlighted in red font. C Validation of altered glucose and nucleotide metabolism genes by quantitative PCR in wildtype and dnajc21−/− whole kidney marrows (WKMs) at 8 months post-fertilization. b-actin and eef1a1l1 were used for normalization. *p < 0.01; **p < 0.001.