
|
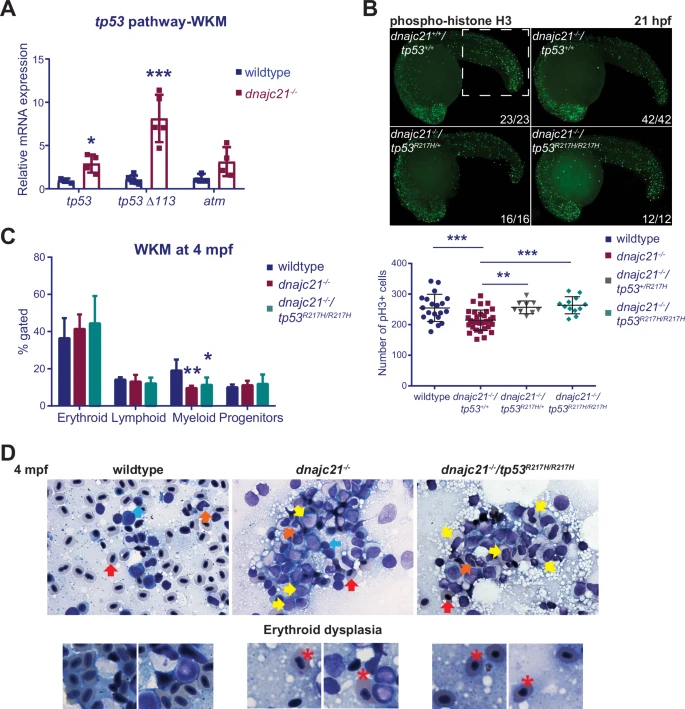
Fig. 4 A gain-of-function tp53 mutation partially rescues neutropenia but leads to an expansion of immature progenitors.A Levels of tp53, tp53 Δ113 isoform, and atm mRNA measured by qPCR in kidney marrows of wildtype and dnajc21−/− fish at 8 mpf. b-actin and eef1a1l1 were used for normalization. B dnajc21−/− mutants were crossed with tp53R217H/R217H to generate compound mutant dnajc21−/−/tp53R217H/R217H fish. Lateral views of pH3 immunofluorescence in wildtype, dnajc21−/−, dnajc21−/−/tp53R217H/+ and dnajc21−/−/tp53R217H/R217H mutant embryos at 21 hpf. Experiments were done in 2 biological replicates. Numbers on the lower right indicate the number of larvae with the same phenotype. The white dotted box marks the region used for counting. The number of pH3+ cells per embryo is quantified in the graph. C Flow cytometry of kidney marrows from wildtype (n = 5), dnajc21−/− (n = 5) and dnajc21−/−/tp53R217H/R217H (n = 3) fish at 4 mpf. Hematopoietic lineages were detected based on the forward and side scatter profiles. D Representative images from Giemsa staining of kidney marrow touch preparations from wildtype (n = 3), dnajc21−/− (n = 5), and dnajc21−/−/tp53R217H/R217H (n = 4) fish at 4 mpf. Arrows indicate mature erythrocytes (red), lymphocytes (blue), myelocytes (yellow), and mature neutrophils (orange). Red asterisks mark dysplastic erythrocytes. hpf: hours post-fertilization; mpf: months post-fertilization *p < 0.01; **p < 0.001; ***p < 0.0001.