
Fig. 3
- ID
- ZDB-IMAGE-241004-28
- Publication
- Guerrero-Limón et al., 2024 - Exploring Estrogen antagonism using CRISPR/Cas9 to generate specific mutants for each of the receptors
- All Figures
- Figures for Guerrero-Limón et al., 2024
|
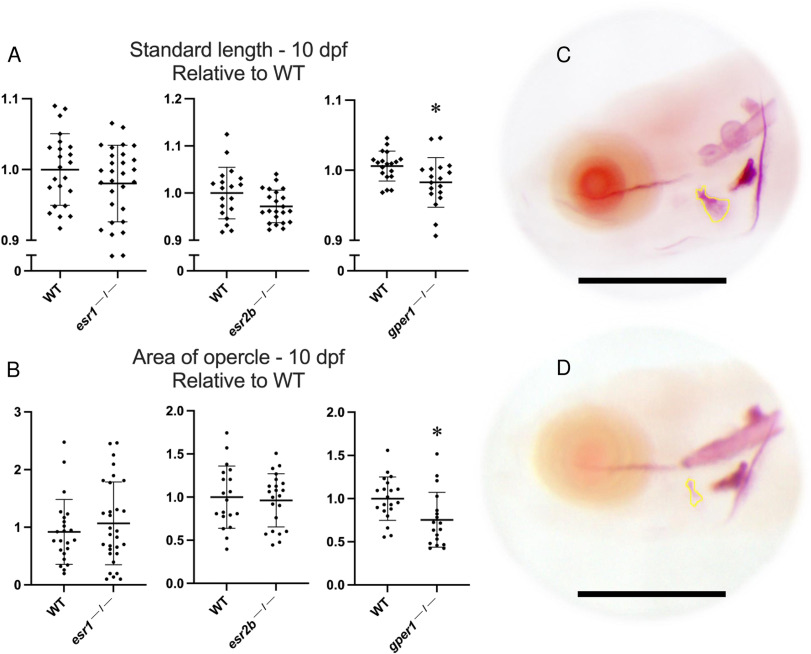
Fig. 3 A) Standard length of mutant larvae at 10 dpf relative to their WT siblings; B) opercle area measured for all mutant larvae relative to their WT siblings; C) Example of alizarin red stained WT larva and D) a gper1⎯/⎯ mutant, the opercle area measured using FIJI is outlined in green, the size bar represents 500 μm. Unpaired Mann-Whitney t-test. Asterisks (*) indicate when significant differences were found for each mutant strain compared to its WT siblings, p < 0.05 (*). All values were normalized relative to the mean value of the corresponding WT siblings for each mutant strain. (For interpretation of the references to colour in this figure legend, the reader is referred to the Web version of this article.)