
Image
|
Figure Caption
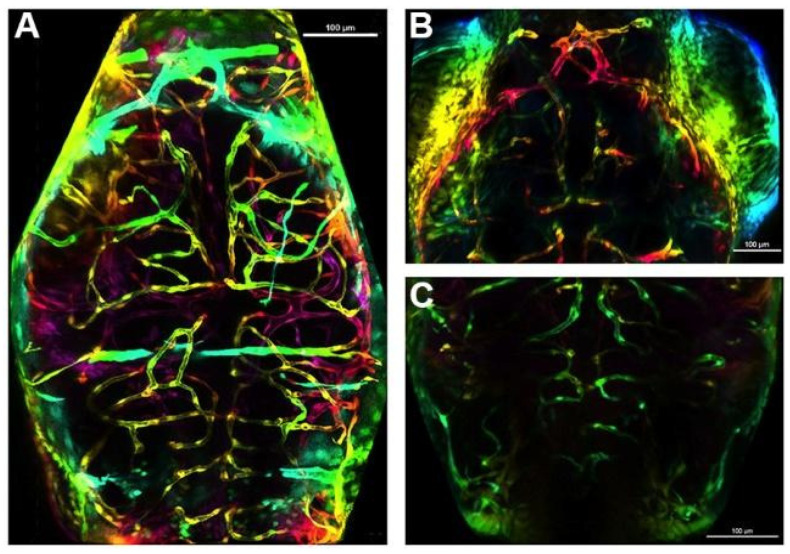
Figure 4
Examples of decreases observed in the mesencephalon (midbrain) and cerebellum (hindbrain) vasculature at 72 hpf. A representative brain of a fish in the control treatment group (
Acknowledgments
This image is the copyrighted work of the attributed author or publisher, and
ZFIN has permission only to display this image to its users.
Additional permissions should be obtained from the applicable author or publisher of the image.
Full text @ Toxics