
Image
|
Figure Caption
Figure 1
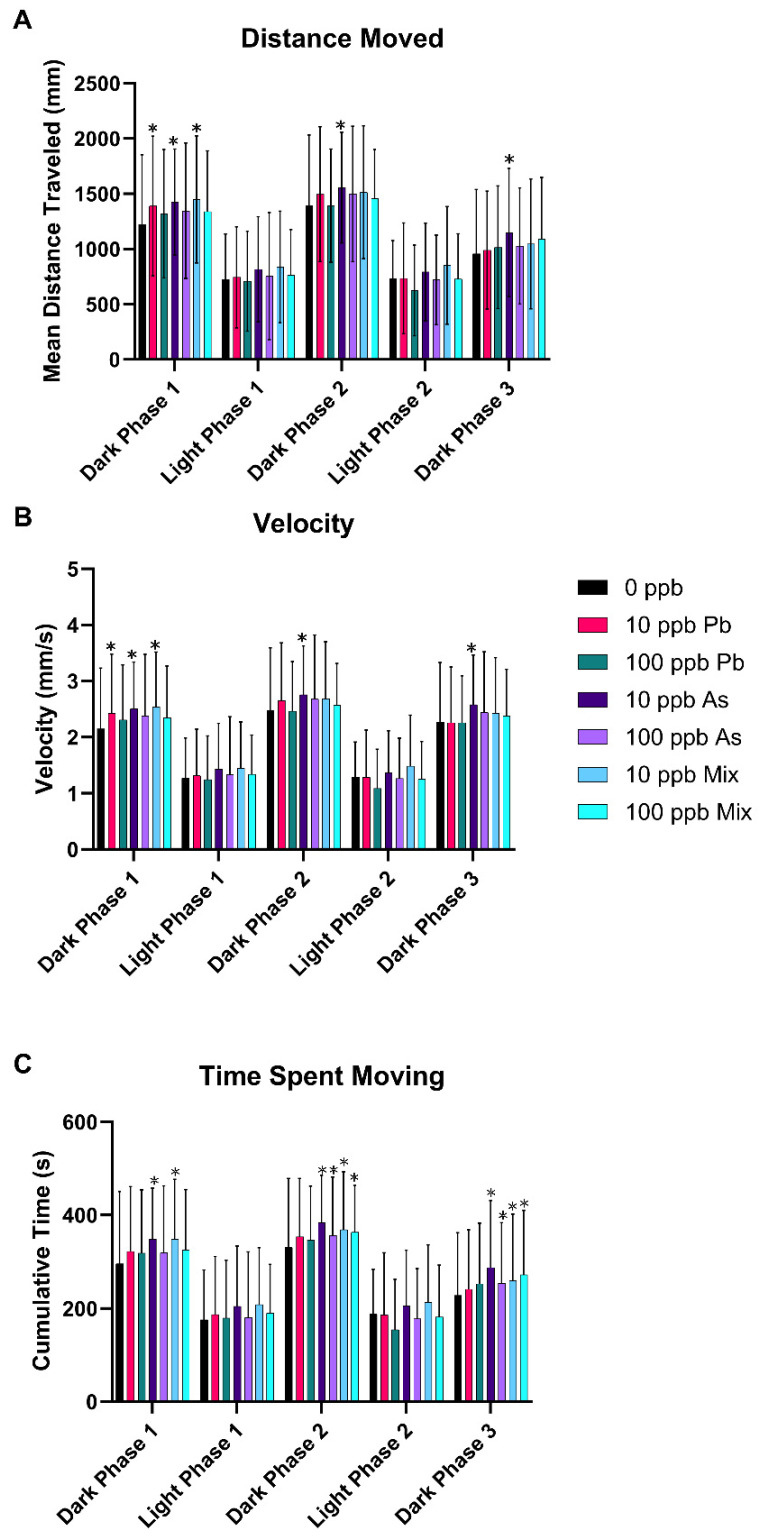
Neurobehavioral endpoints after developmental exposure to As, Pb, or a mixture of both from 1 to 120 hpf. Zebrafish larvae behavior was measured using the visual motor response assay and distance traveled (
Acknowledgments
This image is the copyrighted work of the attributed author or publisher, and
ZFIN has permission only to display this image to its users.
Additional permissions should be obtained from the applicable author or publisher of the image.
Full text @ Toxics