
IMAGE
Fig. 2
- ID
- ZDB-IMAGE-240930-118
- Publication
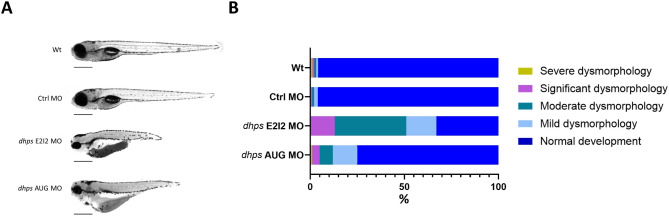
- Shojaeinia et al., 2024 - Deoxyhypusine synthase deficiency syndrome zebrafish model: aberrant morphology, epileptiform activity, and reduced arborization of inhibitory interneurons
- All Figures
- Figures for Shojaeinia et al., 2024
Image
|
Figure Caption
Fig. 2
Phenotypic analysis of
Figure Data
Acknowledgments
This image is the copyrighted work of the attributed author or publisher, and
ZFIN has permission only to display this image to its users.
Additional permissions should be obtained from the applicable author or publisher of the image.
Full text @ Mol. Brain