IMAGE

Fig. 6

ID
ZDB-IMAGE-240920-7
Source
Figures for Bai et al., 2024
Image
Figure Caption

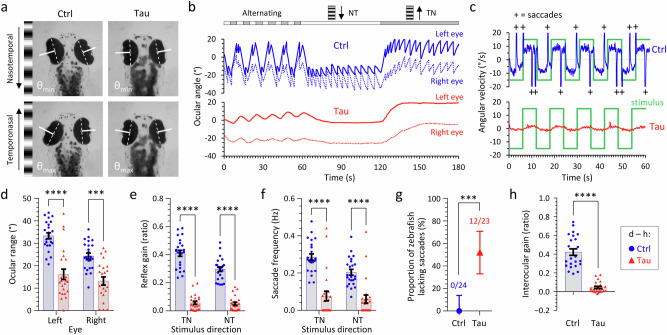
Fig. 6 Optokinetic reflex abnormalities in transgenic zebrafish expressing human 4R/0N-Tau.

Optokinetic reflexes (OKR) were elicited at 5dpf and detected, measured, and analyzed using an automated tracking system40. a Single video frames showing the extremes of ocular position after presenting a nasotemporal (above) or temporonasal (below) stimulus to the left eye of Ctrl (left) or Tau (right) zebrafish. The ocular axes detected by the algorithm are shown in white. The difference between maximum and minimum angle is quantified as ocular range in panel d. b Example nystagmograms showing ocular angle (0 denotes long axis of eye parallel to y-axis of image) for the left (stimulated; solid line) and right (contralateral; broken line) eyes from Ctrl (blue; above) and Tau (red; below) zebrafish in response to successive 1-min periods of alternating (10 s each direction), nasotemporal, and temporonasal stimuli. c Comparison of the stimulus angular velocity (green) and the left eye angular velocity for Ctrl (blue; above) and Tau (red; below) zebrafish. High-velocity saccadic positional resetting movements (velocity exceeds axis limits) are indicated by ‘+’ in the Ctrl trace. The relationship between the stimulus and slow phase tracking movements is quantified as reflex gain in panel e. The frequency of saccadic movements is quantified in panel f. dh Quantification of OKR responses in Ctrl and Tau zebrafish. In each graph df, h, data points show individual zebrafish (Ctrl, n = 24; Tau, n = 23), bars show mean ± SE. d Ocular range (****p = 8.2 × 10−10, ***p = 3.3 × 10−5); e reflex gain (****p < 10−15); f saccade frequency (****p = 2.3 × 10−10, ***p = 5.3 × 10−6); (h) interocular gain (****p = 3.6 × 10−11); Ctrl vs. Tau, (df) 2-way ANOVA with Šidák multiple comparisons test, h 2-tailed unpaired t-test with Welch’s correction. g Proportion of zebrafish lacking high-velocity saccadic movements; bars show proportion ±95% CI, ***p = 0.000026, 2-sided Fisher’s exact test. Source data are provided as a Source Data file.

Acknowledgments
This image is the copyrighted work of the attributed author or publisher, and ZFIN has permission only to display this image to its users. Additional permissions should be obtained from the applicable author or publisher of the image. Full text @ Nat. Commun.