
Image
|
Figure Caption
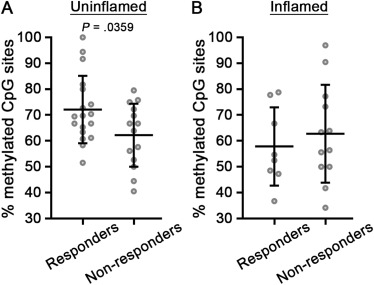
Fig. 4 Anti-TNF nonresponders have lower levels of TNF methylation than responders. (A and B) TNF methylation analysis of anti-TNF responders and nonresponders in uninflamed (A) or inflamed (B) mucosa (responders, uninflamed, n = 18 samples; nonresponders, uninflamed, n = 14 samples; responders, inflamed, n = 8 samples; nonresponders, inflamed, n = 12 samples). Data points are average methylation values from individual cases. Mean ± SD are plotted. P values were calculated using parametric unpaired t-tests. SD, standard deviation; TNF, tumor necrosis factor.
Acknowledgments
This image is the copyrighted work of the attributed author or publisher, and
ZFIN has permission only to display this image to its users.
Additional permissions should be obtained from the applicable author or publisher of the image.
Full text @ Gastro Hep Adv