
|
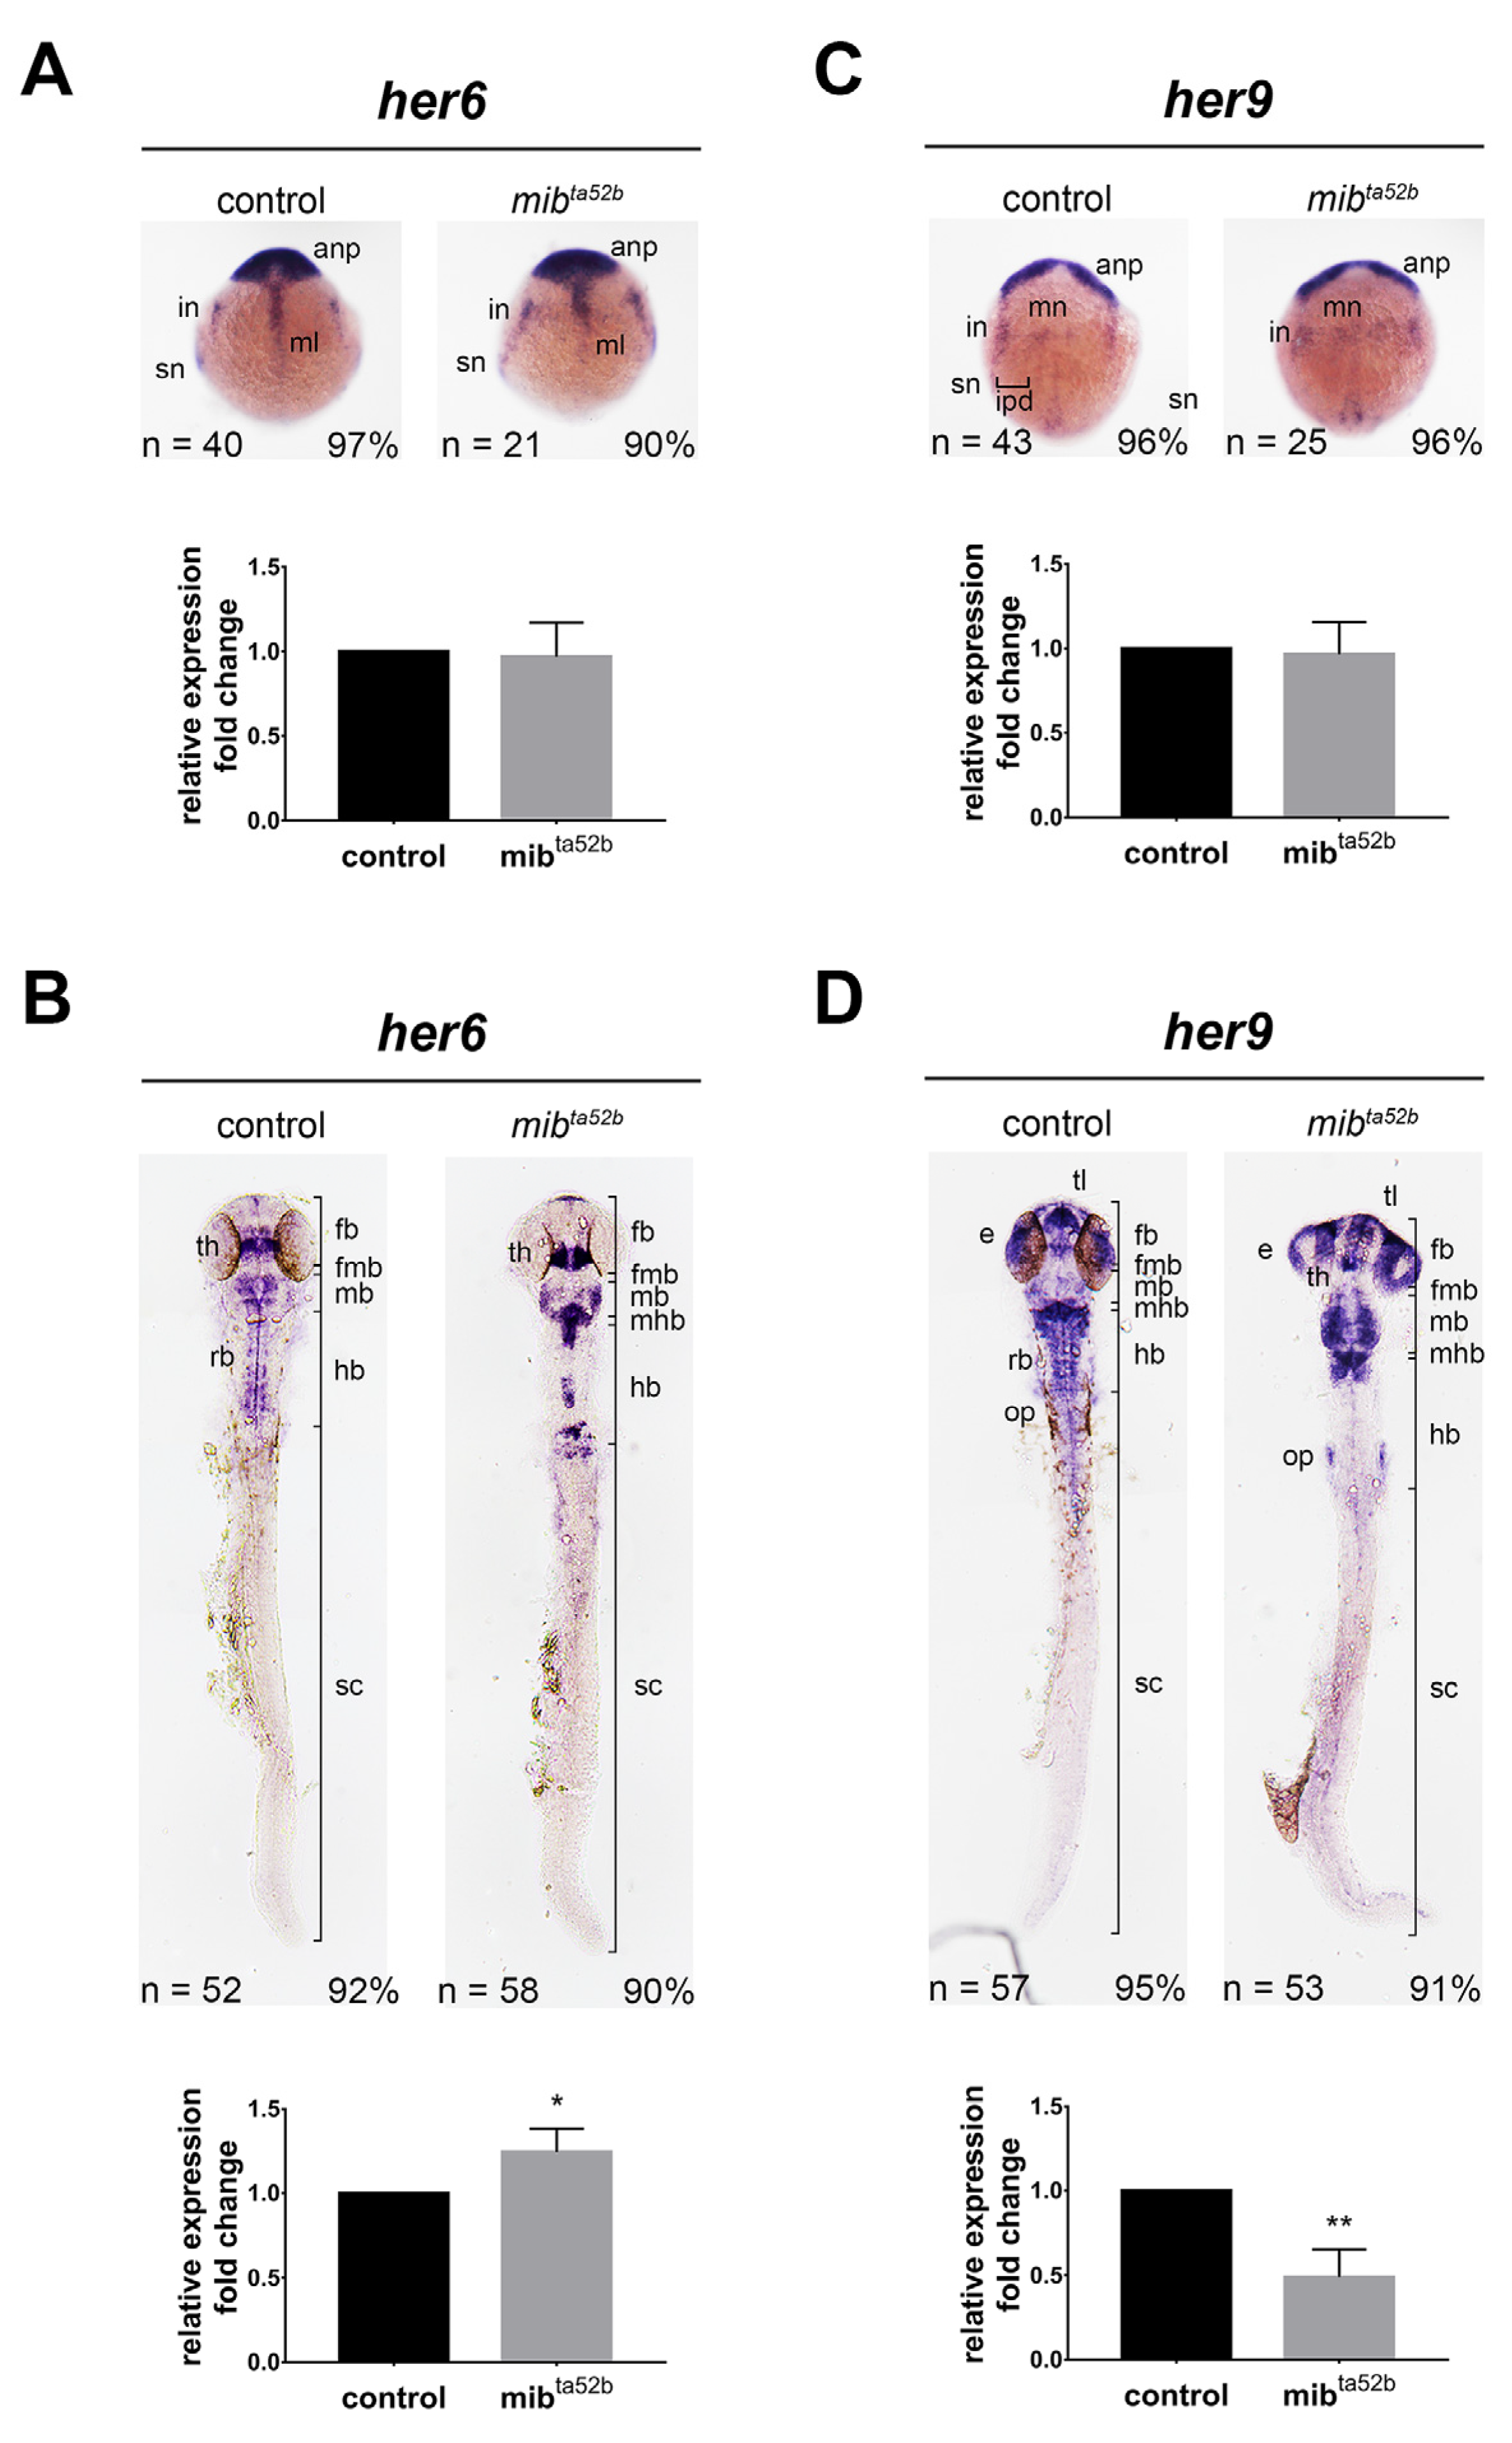
Fig. 1 Comparison of her6 and her9 expression between wild-type sibling and mib1 ta52 b mutant zebrafish.In situ hybridization was conducted to assess the spatial expression of her6 and her9 mRNA in wild-type and mib1 ta52 b homozygous embryos. (A) her6 expression at the bud stage, (B) her6 expression at 24 h post-fertilization (hpf), (C) her9 expression at the bud stage, and (D) her9 expression at 24 hpf. Embryos are depicted in dorsal views with anterior to the top. To facilitate imaging, the yolk of 24 hpf embryos was removed and flat-mounted. Key anatomical features include the anp, anterior neural plate; e, eye; fb, forebrain; fmb, fore-midbrain boundary; hb, hindbrain; in, interneurons; ipd, inter-proneuronal domain; mb, midbrain; mhb, mid-hindbrain boundary; ml, midline; mn, motoneurons; op. otic placode; rb, rhombomeres; th, thalamus; sn, sensory neurons. The percentages in each panel indicate the proportion of embryos displaying the same phenotype as that shown in the photographs of the total embryos examined. The column charts at the bottom of each in situ hybridization photo represent the quantification of mRNA expression using qRT-PCR. Quantitative data are presented as mean ± standard error of mean (SEM); statistical analysis was performed by Student’s t-test. All reactions were performed in triplicate for each sample. *, p < 0.05; **, p < 0.01.