
Image
|
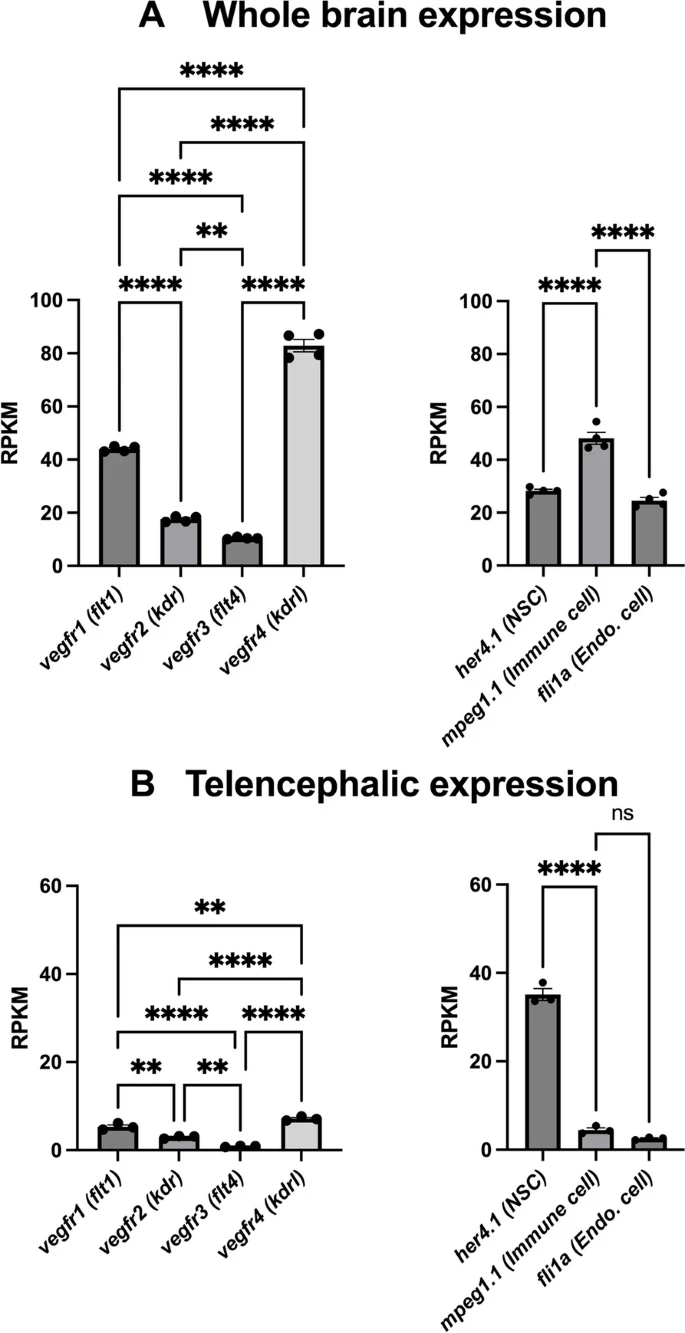
Figure Caption
Fig. 6 Gene expression levels of the different vegf receptors in the whole brain and the telencephalon. Extraction of RNA sequencing data sets from [27, 61, 78] showing relative expression levels of genes for different vegf receptors in the whole brain (A) or telencephalon (B). Note that specific neural stem cell (her4.1), microglia/immune cell (mpeg1.1), and endothelial gene (fli1a) markers were provided for comparison of gene expression levels. These data show that vegfr are expressed at significant levels in a manner similar to most of the reference markers
Acknowledgments
This image is the copyrighted work of the attributed author or publisher, and
ZFIN has permission only to display this image to its users.
Additional permissions should be obtained from the applicable author or publisher of the image.
Full text @ Neural Dev.