
|
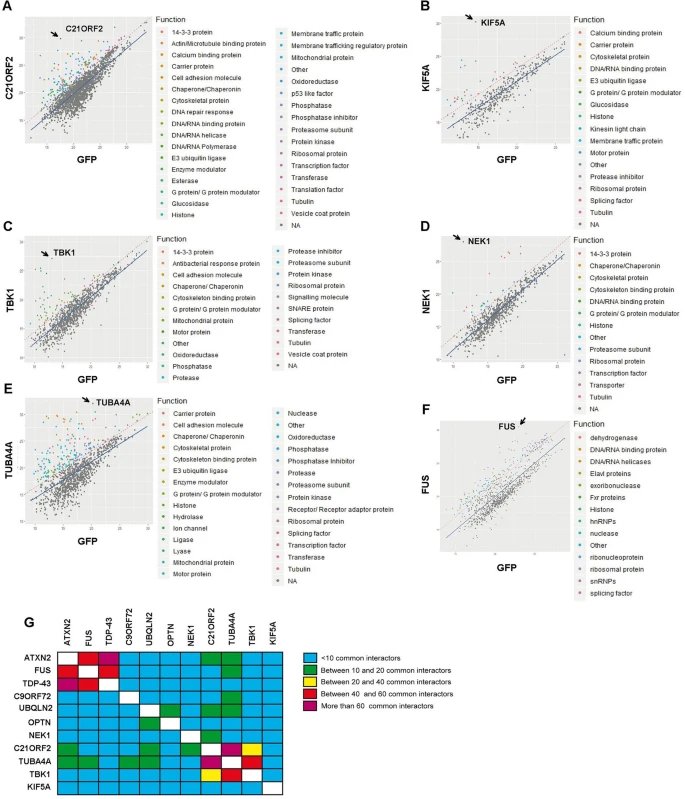
Fig. 2 Analysis of the binding partners of six ALS-associated proteins. A–F Scatter plots showing the interactors of the indicated bait proteins. Each graph shows all proteins identified in the GFP-tagged protein sample (y-axis) versus proteins in a corresponding GFP control sample (x-axis). Each protein is plotted according to its intensity value (abundance) in the sample. The blue line represents the intensity value that is the same for both GFP-tagged protein and GFP control samples. The red line indicates the cutoff used (4 times enrichment in the GFP-tagged sample) to detect probable interactors. These interactors are also colored according to their predicted function (GO analysis using PANTHER software). For each graph the position of the GFP-tagged (bait) protein is indicated (arrow). G Heatmap summarizing the shared interactors of 11 ALS-associated bait proteins analyzed in the current study and our previous work (Blokhuis et al., 2016)