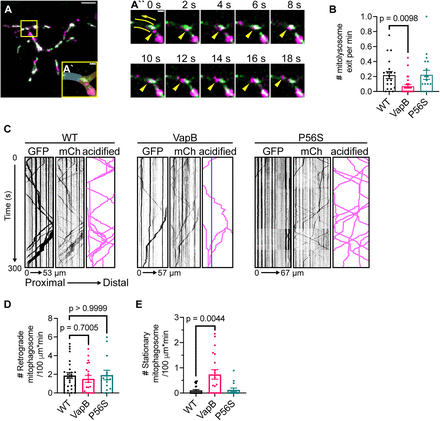
Fig. 4 Exogenous VapB expression stalls mitophagosome transport. A, Representative image of mitophagosome exits from a WT axon terminal. Branchpoint connecting axon to axon terminal boxed and magnified in A` with axon highlighted in blue and axon terminal in yellow. The 18 s excerpt of Movie 1 axon branchpoint time lapse shows mitophagosome (yellow arrowhead) exit from the example axon terminal (A``). The arrow denotes direction of retrograde transport toward cell body, two lines border the path of mitophagosome travel. See Movie 1. B, Quantification of mitophagosome exit event frequency calculated from 20 min time-lapse imaging sessions. C, Example kymographs from axons of WT, VapB transgenic, and VapBP56S transgenic expressing the mitophagy indicator showing transport of unacidified (GFP) and all mitochondria (mCh). Schematic traces of acidified mitochondrial transport are illustrated on the right. Stationary acidified mitochondria traced in blue. D, E, Number of retrograde (D) and stationary (E) acidified mitochondria (mCherry only) in pLL axons expressing the mitophagy indicator. Scale bar: 5 μm in A, 1 μm in A` and A``. Each data point for B, D, and E represents the average calculated from an individual animal. All data represented as mean ± SEM. Kruskal–Wallis with Dunn's post hoc contrasts in B, D, and E.
Image
Figure Caption
Acknowledgments
This image is the copyrighted work of the attributed author or publisher, and
ZFIN has permission only to display this image to its users.
Additional permissions should be obtained from the applicable author or publisher of the image.
Full text @ J. Neurosci.

