
Image
|
Figure Caption
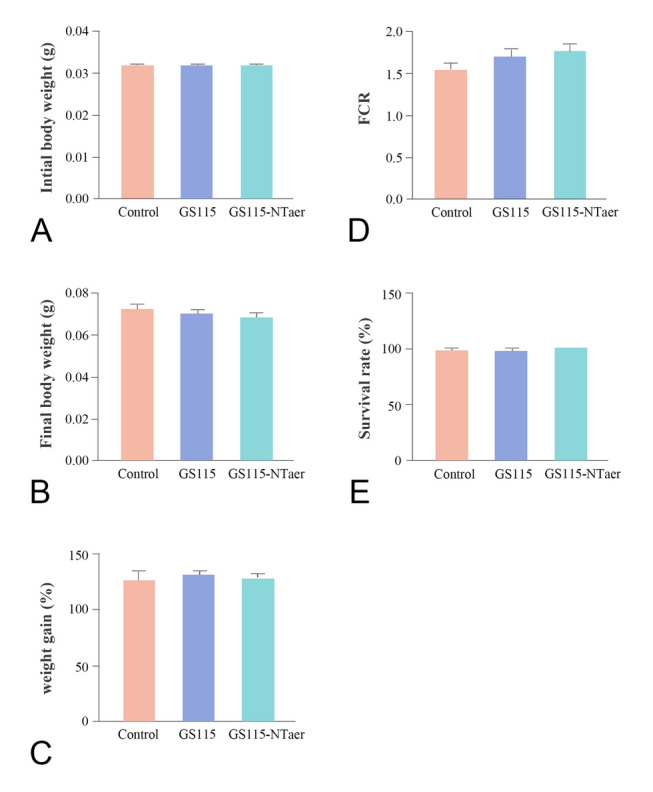
Fig. 2
Growth performance of zebrafish fed with control diet, GS115 or GS115-NTaer vaccine.
Acknowledgments
This image is the copyrighted work of the attributed author or publisher, and
ZFIN has permission only to display this image to its users.
Additional permissions should be obtained from the applicable author or publisher of the image.
Full text @ Mar Life Sci Technol