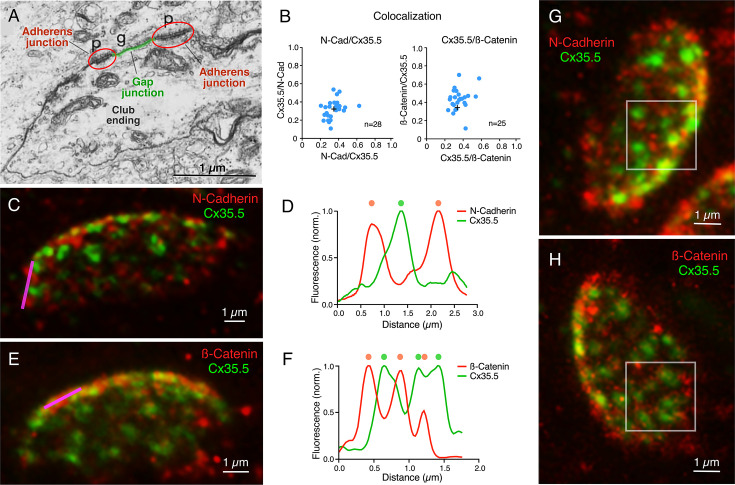
Figure 6.
Gap junctions (GJs) at club endings (CEs) are associated with adherens junctions (AJs).
(A) Electron micrograph of a CE obtained in a 6 days post fertilization (dpf) zebrafish showing a GJ (g, highlighted in green) surrounded by AJs (p, encircled in red). ((A) was reproduced from Figure 5 of Kimmel et al., 1981, with permission from John Wiley and Sons. It is not covered by the CC-BY 4.0 license and further reproduction of this panel would need permission from the copyright holder; Kimmel et al., 1981.) (B) GJ and AJ proteins do not colocalize. Left: Cx35.5 and N-cadherin labeling show a low index of colocalization. Manders’ coefficient: N-cadherin/Cx35.5 0.35 ± 0.016 (x-axis); Cx35.5/N-cadherin 0.32 ± 0.019 (y-axis), n = 28 CEs from 10 fish. Right: Cx35.5 and β-catenin labeling also show low colocalization. Manders’ coefficient: Cx35.5/β-catenin 0.36 ± 0.017 (x-axis); β-catenin/Cx35.5 0.43 ± 0.024 (y-axis), n = 25 CEs from 12 fish. Cross mark indicates the average value. (C) Expansion microscopy of a CE contact area labeled for N-cadherin (red) and Cx35.5 (green) (projection of 47 sections at 0.40 µm z-step size). (D) Fluorescence profiles for N-cadherin and Cx35.5 obtained with a line scan (magenta line in C) are mutually exclusive. The small degree of colocalization observed in (B) is likely due to fluorophore amplification and the close spatial association between GJs and AJs, as shown in (A). (E) Image shows an expanded CE contact area labeled for β-catenin (red) and Cx35.5 (green) (projection of 12 sections at 0.60 µm z-step size). (F) Line scan (magenta line in E) shows that labeling for β-catenin and Cx35.5 is also mutually exclusive. (G, H) ‘En face’ view of the expanded contact area double-labeled for N-cadherin and Cx35.5, and β-catenin and Cx35.5, respectively, showing the close association of GJs and AJs throughout the synaptic contact area. Insets: the boxed areas in the ‘en face’ images highlight the mutually exclusive labeling (G: projection of 24 sections at 0.50 µm z-step size; H: projection of 16 sections at 0.60 µm z-step size). The scale bars represent actual dimensions; expanded images were not adjusted for the expansion factor.
Acknowledgments
This image is the copyrighted work of the attributed author or publisher, and
ZFIN has permission only to display this image to its users.
Additional permissions should be obtained from the applicable author or publisher of the image.
Full text @ Elife
Your Input Welcome
Thank you for submitting comments. Your input has been emailed to ZFIN curators who may contact you if
additional information is required.
Oops. Something went wrong. Please try again later.