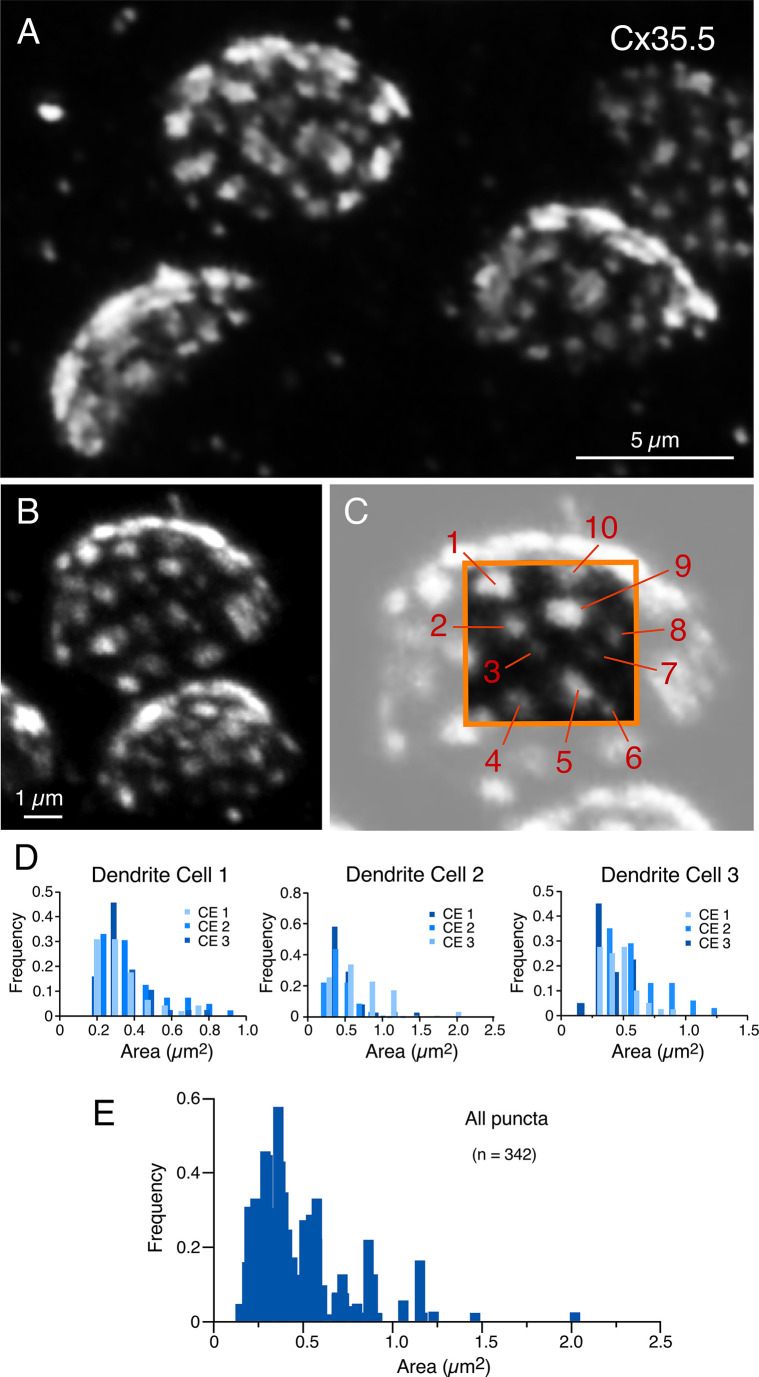
Figure 5.
Expansion reveals the presence of multiple, variably sized, gap junctions.
(A, B) ‘En face’ views of expanded club ending (CE) contact areas labeled with anti-Cx35.5 showing multiple puncta with high variability of their size (A: projection of 18 sections at 0.60 µm z-step size; B: projection of 19 sections at 0.88 µm z-step size). (C) Magnification of the CE contact area at the top of (B) (light gray). The area enclosed by the orange box illustrates the wide variability in puncta size, labeled 1–10 (to better highlight the variability in puncta size, the image delimited by the orange box was cropped from and placed on the same region of the lighter image). Panels (B) and (C) are the same experiment as Figures 1E and 3B–D, demonstrating the ability of expansion microscopy for providing multiple layers of information within the same experiment. (D) Frequency histograms summarize the number and size distribution of puncta labeled for Cx35.5 obtained from three dendrites, each belonging to a different fish (bar graphs labeled as ‘Dendrite cell 1’, ‘Dendrite cell 2’, ‘Dendrite cell 3’). Each histogram illustrates, overlapped in different shades of blue, the values obtained from the analysis of three ‘en face’ views of CE terminals. Histograms show similar variability in number and size for all nine terminals. (E) Frequency histogram summarizes the average values resulting from the analysis of all nine ‘en face’ CE views. The scale bars represent actual dimensions; expanded images were not adjusted for the expansion factor.
Acknowledgments
This image is the copyrighted work of the attributed author or publisher, and
ZFIN has permission only to display this image to its users.
Additional permissions should be obtained from the applicable author or publisher of the image.
Full text @ Elife
Your Input Welcome
Thank you for submitting comments. Your input has been emailed to ZFIN curators who may contact you if
additional information is required.
Oops. Something went wrong. Please try again later.