
|
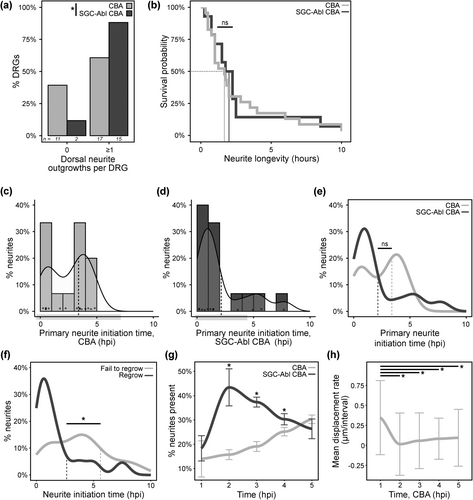
Fig. 4 Dorsal root ganglion sensory neurons are more likely to regrow a new central branch when subject to satellite glial cell (SGC) ablation. (a) Comparison of the number of dorsal root ganglia (DRG) that exhibit either zero or one or more dorsal neurite outgrowths following CBA (light fill, 61% with one or more dorsal neurite outgrowths; n = 17/28 DRGs from 18 fish) or (SGC-ABL) with CBA (dark fill, 88% with one or more dorsal neurite outgrowths; n = 15/17 DRGs from 14 fish; Barnard's test, p = .038). (b) Survival curves of neurite longevity from CBA (light line, mean: 2.89 ± 3.59 h) and SGC-Abl CBA (dark line, mean: 3.21 ± 4.49 h) injury conditions. Vertical lines mark the time (h) at which neurite survival probability is 50% (n = 37 neurites from 21 DRGs from 15 fish; log-rank test, p > .05). (c–e) Quantification of time (hours post-injury [hpi]) at which the first dorsal neurite forms and initiates growth from the sensory neuronal soma following (c) CBA alone (light, mean: 3.38 ± 3.74 hpi) or (d) SGC-Abl CBA (dark, mean: 2.14 ± 2.31 hpi). Curves represent smoothed density estimates. Dashed lines indicate mean initiation time for each condition (n = 31 DRG primary neurites from 19 fish; Wilcoxon test, p > .05). (f) Quantification of initiation time of neurites that fail (light curve, mean: 5.61 ± 4.59 hpi) or successfully regrow into the dorsal spinal cord (dark curve, mean: 2.64 ± 3.70 hpi), pooled from both injury conditions (n = 52 neurites from 30 DRGs from 19 fish; Wilcoxon test, p = .0054). Dashed lines indicate mean initiation time. (g) Quantification of the percent of neurites present in 1 h time windows post-injury, compared between CBA (2 hpi mean: 16% ± 2%, 4.5/28 neurites) and SGC-Abl CBA neurons (2 hpi mean: 45% ± 8%, 10.75/24 neurites; Wilcoxon test with Bonferroni's correction, p < .05). (h) Mean displacement rate (μm/imaging time interval) of SGC nuclei in 1 h time windows post-CBA (n = 43 cells from 23 DRGs from 15 fish; Wilcoxon paired-sample test with Bonferroni's correction, p < .05). Error bars represent ±1 standard deviation. nsp ≥.05, *p < .05.