
|
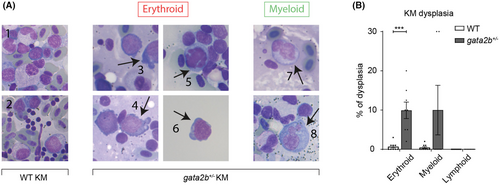
Fig. 1 Gata2b+/− kidney marrow (KM) shows erythroid and myeloid dysplasia. (A) Representative pictures of KM smears after May–Grünwald–Giemsa staining of wild-type (WT) KM smears (panels 1 and 2) and gata2b+/− KM smears (panels 3–8). (3) Blebbing in the cytoplasm of proerythroblast; (4) irregular cytoplasm in erythroid precursor; (5) lobed nucleus and micronucleus in erythroblast; (6) blebbing in the cytoplasm of the blast of sorted cell after cytospin; (7) binucleated promyelocyte; and (8) multinucleated promyelocyte. (B) Frequency of dysplastic cells of the erythroid, myeloid and lymphoid lineage in KM smears of WT (n = 8) and gata2b+/− (n = 8) zebrafish. ***p < 0.001.