
|
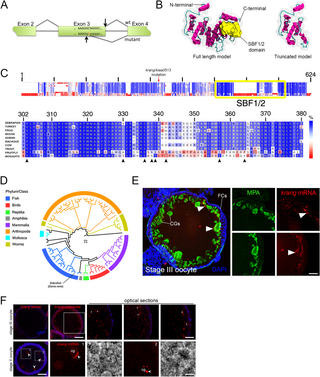
Fig. 6 Molecular characterization of the Krang maternal factor. A. Schematic representation of the molecular lesion and generation of a premature donor splice site 35 nt upstream of the wild type (wt) donor splice site in the krang/kiaa0513 (mutant) transcript. B. Predicted tertiary structure of the full-length zebrafish Krang protein (left) and its truncated version (right). The α-helixes and the connecting loops are colored in pink and green, respectively. N- and C-terminal domains are indicated. The SBF1/2 functional domain of the protein is shown in yellow. The approximate volumetric density map of the protein is shown in translucent gray. C. Krang protein sequence alignment of multiple species represented in E. Top: Schematic representation of the protein sequence alignment. The overall percentage (%) similarity among sequences decreases from top to bottom. The yellow box indicates the SBF1/2 functional domain in Krang. Bottom: Detailed sequence alignment, showing high conservation of this domain in fungi, insects, fish, birds and mammals. Percent similarity is color coded by the scale bar at the right. D. Reduced neighbor-joining phylogenetic tree of Krang homologs found in public databases indicating its evolutionary history from invertebrate to vertebrate species. The scale bar in the middle represents evolutionary distances based on residue substitutions per site. E. In situ hybridization showing the cortically-restricted distribution of krang mRNA in a cryosectioned stage III oocyte (n = 18). Notice that the expression of the transcript (arrowheads) is associated with MPA-stained CGs. FCs, follicle cells. Right panels show selected areas (arrowheads) in separate channels. F. Whole-mount in situ hybridization showing krang transcript localization. Top row: wild-type stage III oocyte (n = 43), where krang mRNA is peripherally distributed in the cell, presumably overlapping with cortical granules (white asterisks in high magnification images of the same oocyte). Bottom row: stage II oocyte (n = 19), where the krang transcript is associated with nascent CGs (bright field and fluorescent high magnification images). Control sense probe did not show transcript signal in stage III oocytes (n = 23, top row, left). Boxes show selected magnified areas. Scale bar = 20 μm (E), 140 μm (F, stage III oocyte), 9 μm (F, top row high magnification images), 55 μm (F, stage II oocyte), 20 μm (F, bottom row high magnification images).